Open Access
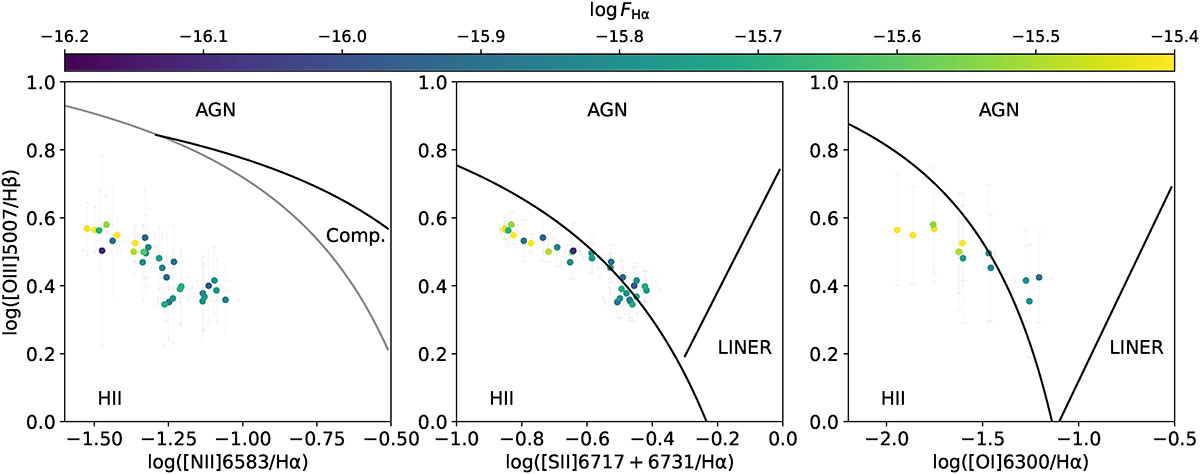
Fig. 4.
Download original image
Diagnostic BPT diagrams. Curved black and gray lines separating the areas of different mechanisms of excitation are from Kewley et al. (2001) and Kauffmann et al. (2003), respectively, while the straight line is from Kewley et al. (2006). The colors of the symbols correspond to Hα brightness.
Current usage metrics show cumulative count of Article Views (full-text article views including HTML views, PDF and ePub downloads, according to the available data) and Abstracts Views on Vision4Press platform.
Data correspond to usage on the plateform after 2015. The current usage metrics is available 48-96 hours after online publication and is updated daily on week days.
Initial download of the metrics may take a while.