Fig. 5.
Download original image
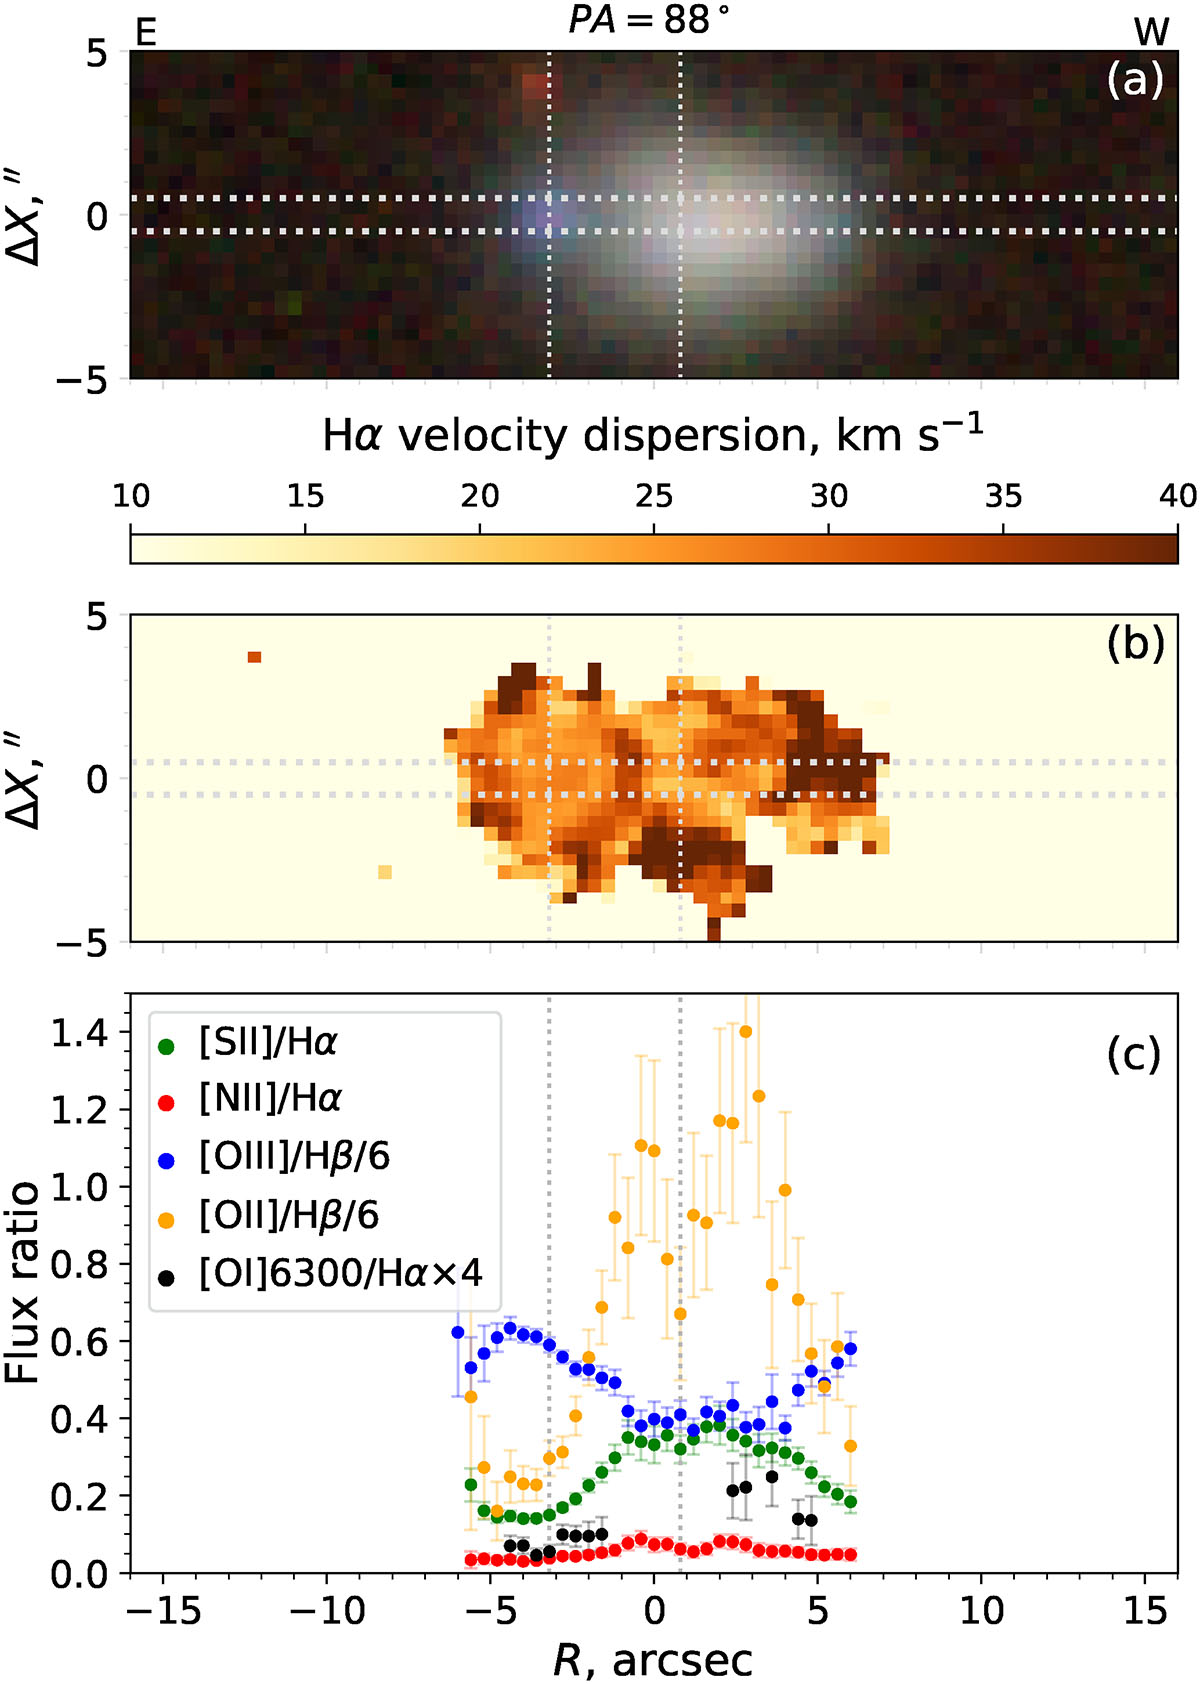
Colored Legacy Survey grz-image (top panel), map of Hα velocity dispersion (middle panel), and distribution of the emission-line fluxes ratios (bottom panel) along the slit PA = 88. The horizontal dashed lines in the top and middle panels show the position of the slit overlaid. The vertical dotted lines denote the positions of the galaxy center and the bright SF clump on the disk periphery.
Current usage metrics show cumulative count of Article Views (full-text article views including HTML views, PDF and ePub downloads, according to the available data) and Abstracts Views on Vision4Press platform.
Data correspond to usage on the plateform after 2015. The current usage metrics is available 48-96 hours after online publication and is updated daily on week days.
Initial download of the metrics may take a while.