Open Access
Fig. 6.
Download original image
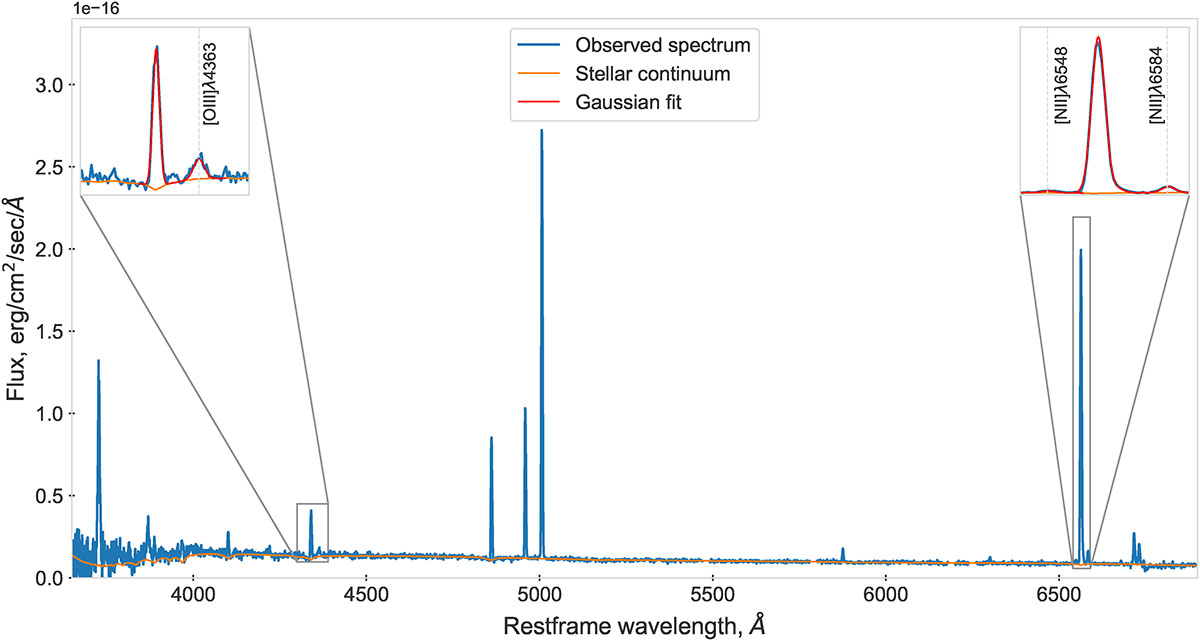
Spectrum of the brightest star-forming region in VGS 12. The observed spectrum at restframe wavelength is shown in blue, the continuum is in orange, and the Gaussian fits for Hγ + [O III]λ4363 and Hα + [N II]λλ6548,6584 lines are shown in zoom-in panels in red.
Current usage metrics show cumulative count of Article Views (full-text article views including HTML views, PDF and ePub downloads, according to the available data) and Abstracts Views on Vision4Press platform.
Data correspond to usage on the plateform after 2015. The current usage metrics is available 48-96 hours after online publication and is updated daily on week days.
Initial download of the metrics may take a while.