Fig. 7.
Download original image
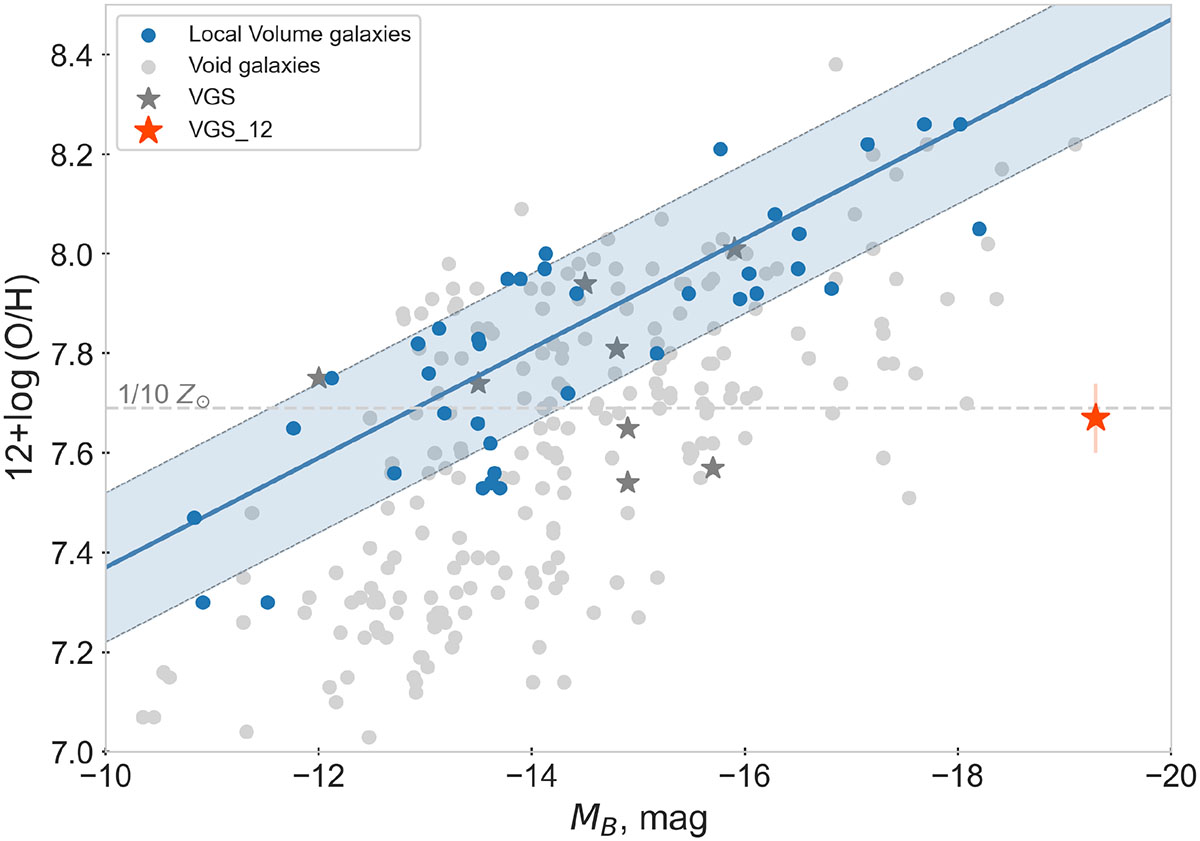
Relation between log(O/H) and the absolute blue magnitude, MB, for void galaxies (gray symbols) and Local Volume sample from Berg et al. (2012, blue symbols). The light gray circles show void galaxies from Kniazev et al. (2018), Pustilnik et al. (2016, 2020, 2021, 2024). The dark gray stars denote galaxies from the Void Galaxy Survey with measured O/H from paper Kreckel et al. (2015). The VGS 12 galaxy is shown as the red star. The solid line shows the linear regression for the control sample from the Local Volume by Berg et al. (2012). Two dashed lines on both sides of the reference line show the root mean square deviation of their sample from the linear regression (0.15 dex). The horizontal dotted black line marks the value 12+log(O/H) = 7.69, which corresponds to Z⊙/10 for Z⊙ from Allende Prieto et al. (2001) and Asplund et al. (2009).
Current usage metrics show cumulative count of Article Views (full-text article views including HTML views, PDF and ePub downloads, according to the available data) and Abstracts Views on Vision4Press platform.
Data correspond to usage on the plateform after 2015. The current usage metrics is available 48-96 hours after online publication and is updated daily on week days.
Initial download of the metrics may take a while.