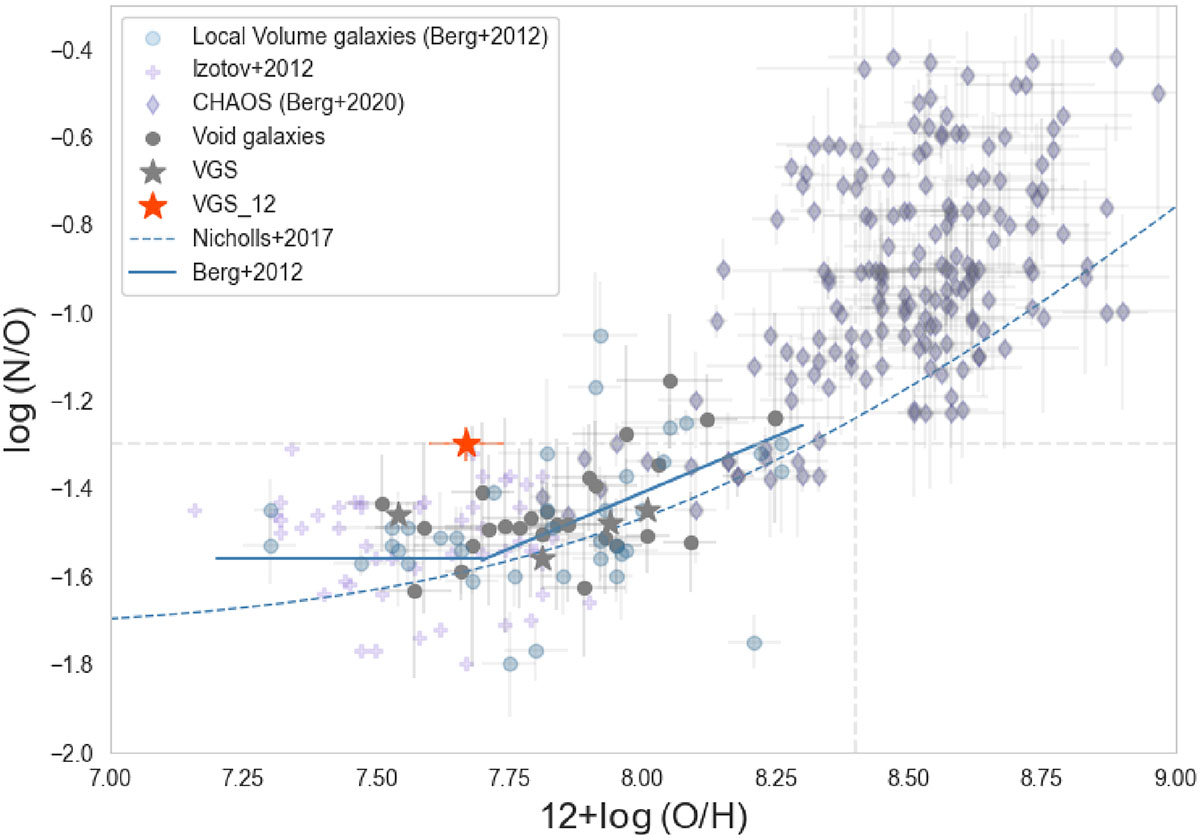
Fig. 8.
Download original image
Relation between log(N/O) and log(O/H). The dark gray circles show void galaxies from Kniazev et al. (2018), Pustilnik et al. (2016, 2020, 2021, 2024). The dark gray stars denote galaxies from the Void Galaxy Survey with measured O/H from paper Kreckel et al. (2015). VGS 12 galaxy is shown as the red star. The purple crosses denote galaxies from Izotov et al. (2012), and blue diamonds denote HII regions in NGC 628, NGC 3184, NGC 5194, and NGC 5457 from the CHAOS survey from Berg et al. (2020). The blue line shows the stellar “log(N/O) – 12 + log(O/H)” relation from Nicholls et al. (2017). The horizontal dashed line marks the measured log(N/O) for VGS 12, and the vertical dashed line marks 12 + log(O/H) expected for the given MB estimated using the relation from Berg et al. (2012).
Current usage metrics show cumulative count of Article Views (full-text article views including HTML views, PDF and ePub downloads, according to the available data) and Abstracts Views on Vision4Press platform.
Data correspond to usage on the plateform after 2015. The current usage metrics is available 48-96 hours after online publication and is updated daily on week days.
Initial download of the metrics may take a while.