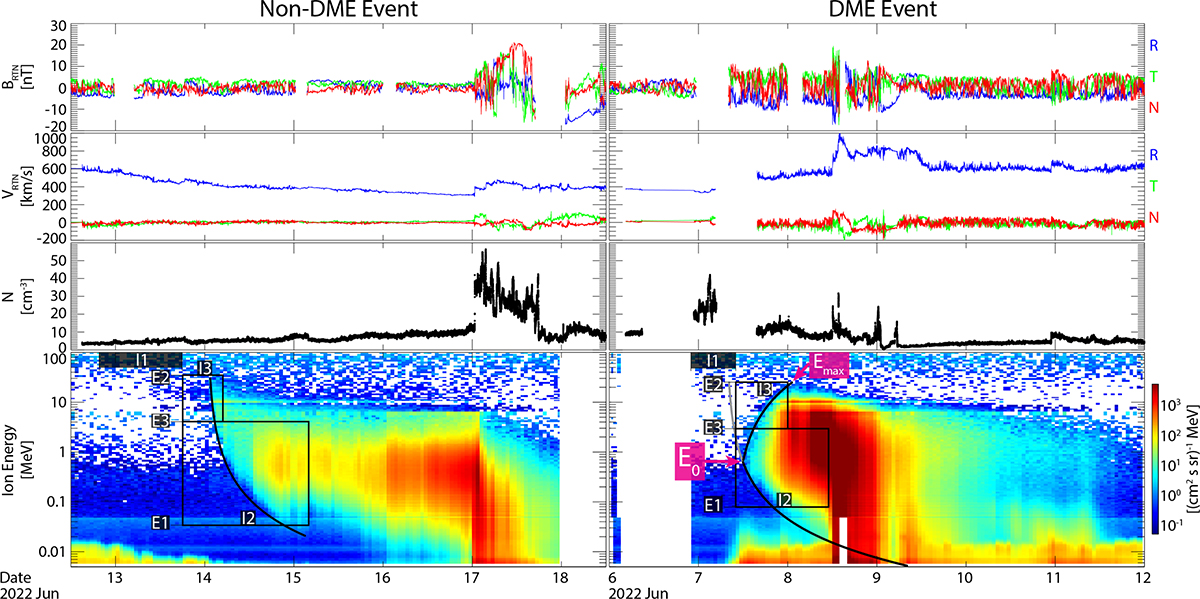
Fig. 1.
Download original image
Magnetic field components from MAG in RTN coordinates, solar wind velocity components in RTN coordinates and density from SWA/PAS, and ion flux spectrograms from EPD (STEP/EPT/HET) shown from top to bottom for a non-DME event (left) and DME event (right). Black curves on the flux spectrograms denote the onset time fittings and the grey curve on the DME event flux spectrogram illustrates the extrapolated VDA fit for the higher energy portion. The point where the lower energy fit of the DME event changes to grey is E0 (as labeled in magenta) and the end of the higher energy fits is Emax (labeled for the DME event). By-eye identified intervals and energies used by the fitting algorithm are shown over the ion spectrogram for illustrative purposes (see text for description).
Current usage metrics show cumulative count of Article Views (full-text article views including HTML views, PDF and ePub downloads, according to the available data) and Abstracts Views on Vision4Press platform.
Data correspond to usage on the plateform after 2015. The current usage metrics is available 48-96 hours after online publication and is updated daily on week days.
Initial download of the metrics may take a while.