Fig. 4.
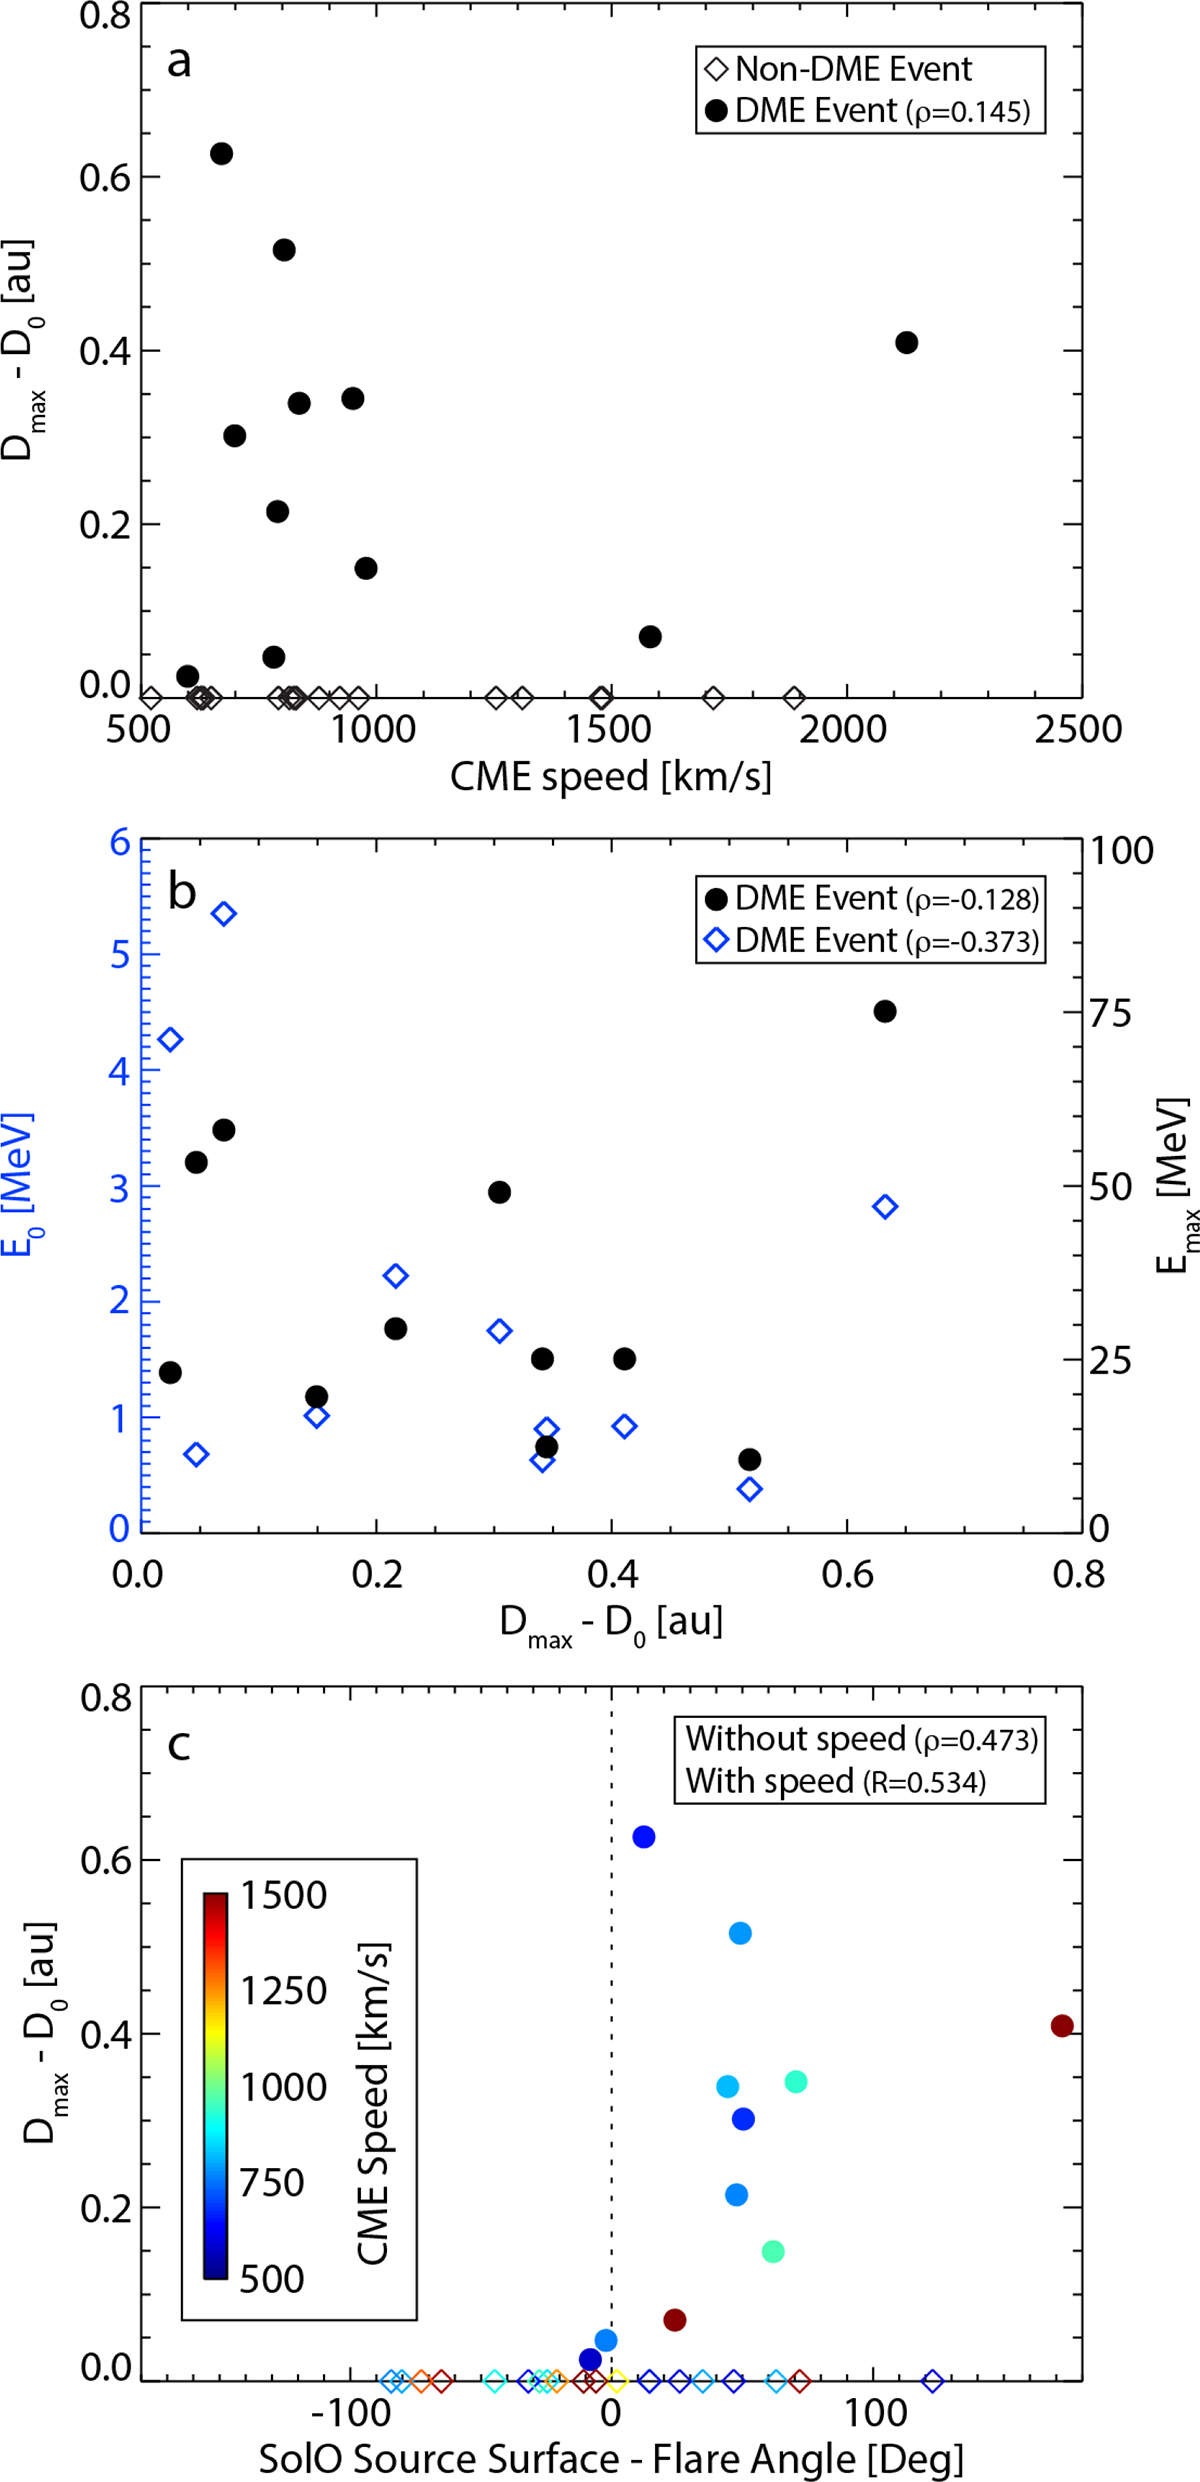
Download original image
(a) Distance between initial particle release and the eventual point of maximum energy particle release into the flux tube observed by Solar Orbiter versus CME speed for DME events (solid circles) and non-DME events (open diamonds). (b) E0 and Emax versus the distance between initial and maximum energy release. (c) Distance between initial and maximum energy release versus footpoint location relative to the associated flare site for different CME speeds (indicated by symbol color).
Current usage metrics show cumulative count of Article Views (full-text article views including HTML views, PDF and ePub downloads, according to the available data) and Abstracts Views on Vision4Press platform.
Data correspond to usage on the plateform after 2015. The current usage metrics is available 48-96 hours after online publication and is updated daily on week days.
Initial download of the metrics may take a while.