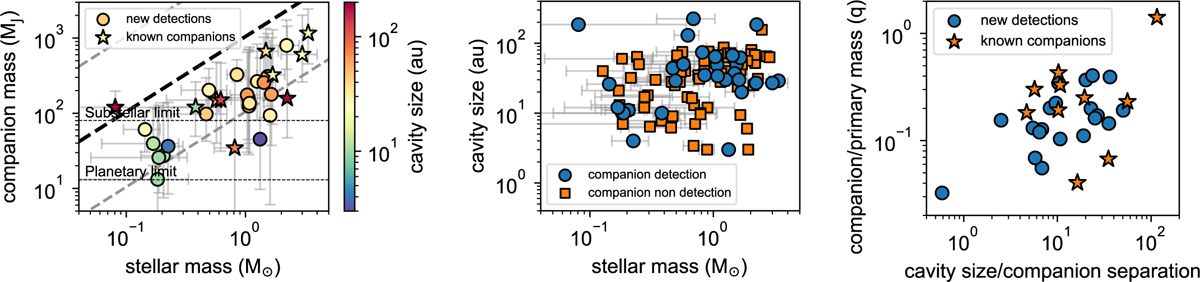
Fig. 5
Download original image
Left panel: stellar mass of the primary star vs companion mass. One-to-one line is shown in black and ± 1 dex lines are shown in grey. Centre panel: stellar mass of the primary star vs cavity size at millimetre wavelengths. Right panel: mass ratio (q) vs cavity size to semi-major axis ratio. We note only median values (50th percentiles) are shown.
Current usage metrics show cumulative count of Article Views (full-text article views including HTML views, PDF and ePub downloads, according to the available data) and Abstracts Views on Vision4Press platform.
Data correspond to usage on the plateform after 2015. The current usage metrics is available 48-96 hours after online publication and is updated daily on week days.
Initial download of the metrics may take a while.