Fig. 1
Download original image
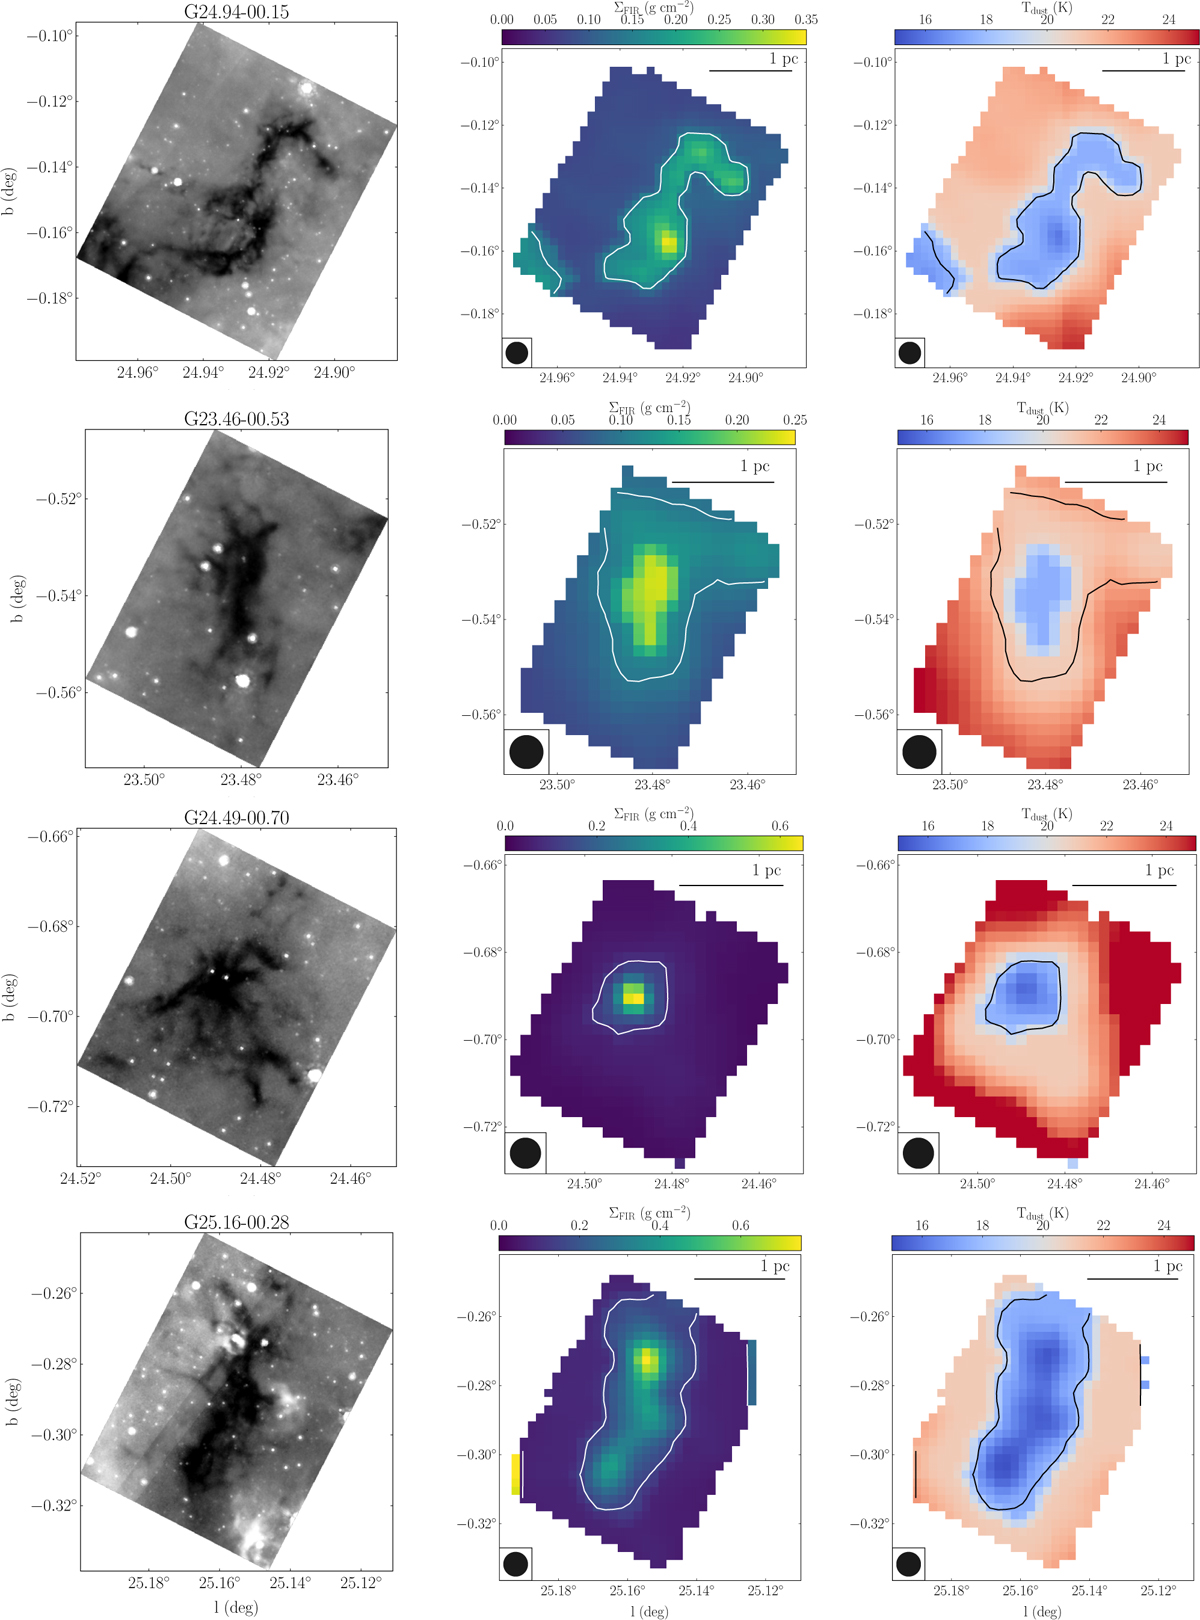
Spitzer 8 µm images (left column), Herschel-derived mass surface density maps (Σ; middle column) and dust temperature (Tdust; right column) for the four IRDCs. In the middle and right panels, the Σ=0.1 g cm−2 black contours highlight the shape of each cloud. The beam size (bottom left) and 1 pc scale bar (top right) are also indicated.
Current usage metrics show cumulative count of Article Views (full-text article views including HTML views, PDF and ePub downloads, according to the available data) and Abstracts Views on Vision4Press platform.
Data correspond to usage on the plateform after 2015. The current usage metrics is available 48-96 hours after online publication and is updated daily on week days.
Initial download of the metrics may take a while.