Fig. 2
Download original image
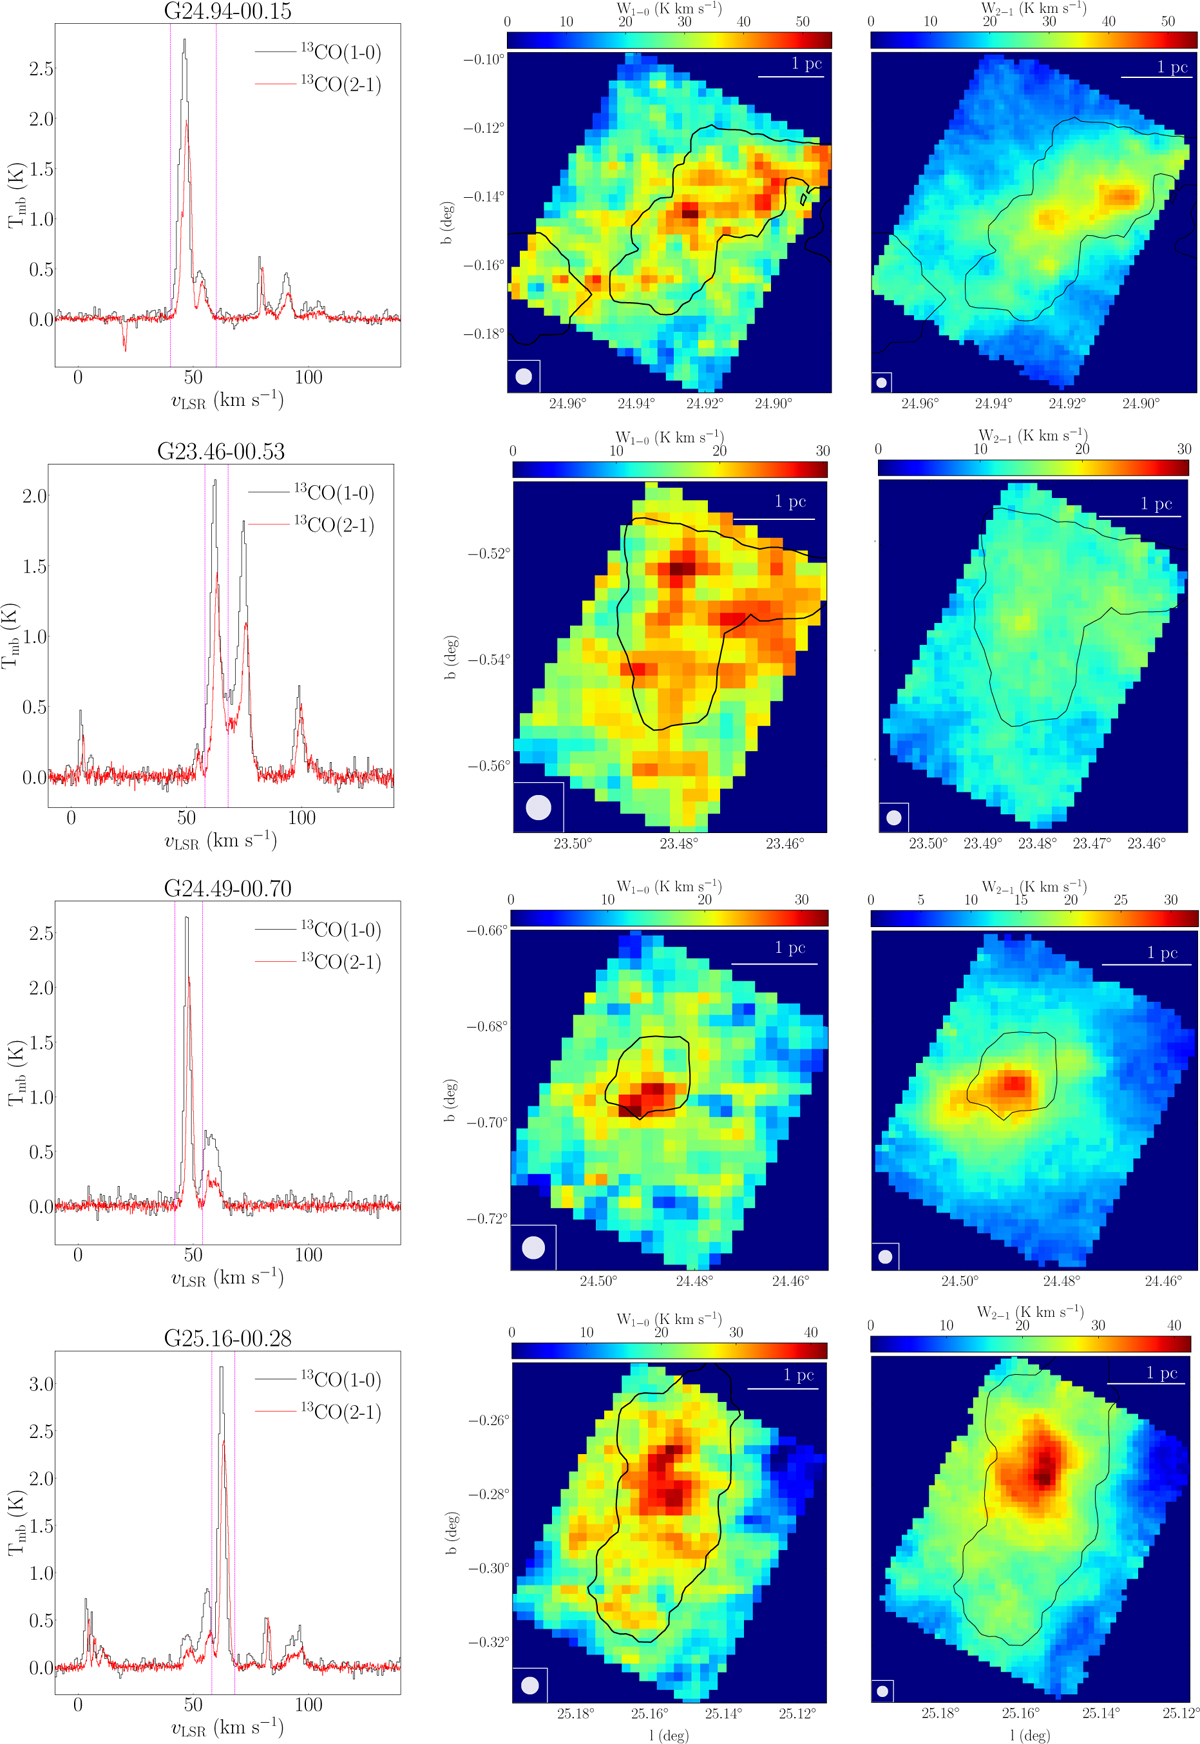
Left column: 13CO(1–0) (black) and 13CO(2–1) (red) spectra averaged towards the full IRDC maps. The velocity ranges considered for each cloud are indicated with vertical dotted magenta lines and are reported in Table 2. Middle and left columns: integrated intensity maps of the 13CO(1–0) and 13CO(2–1) obtained over the defined velocity ranges. In both sets of panels, the beam sizes and 1 pc scale bar are indicated.
Current usage metrics show cumulative count of Article Views (full-text article views including HTML views, PDF and ePub downloads, according to the available data) and Abstracts Views on Vision4Press platform.
Data correspond to usage on the plateform after 2015. The current usage metrics is available 48-96 hours after online publication and is updated daily on week days.
Initial download of the metrics may take a while.