Fig. 1
Download original image
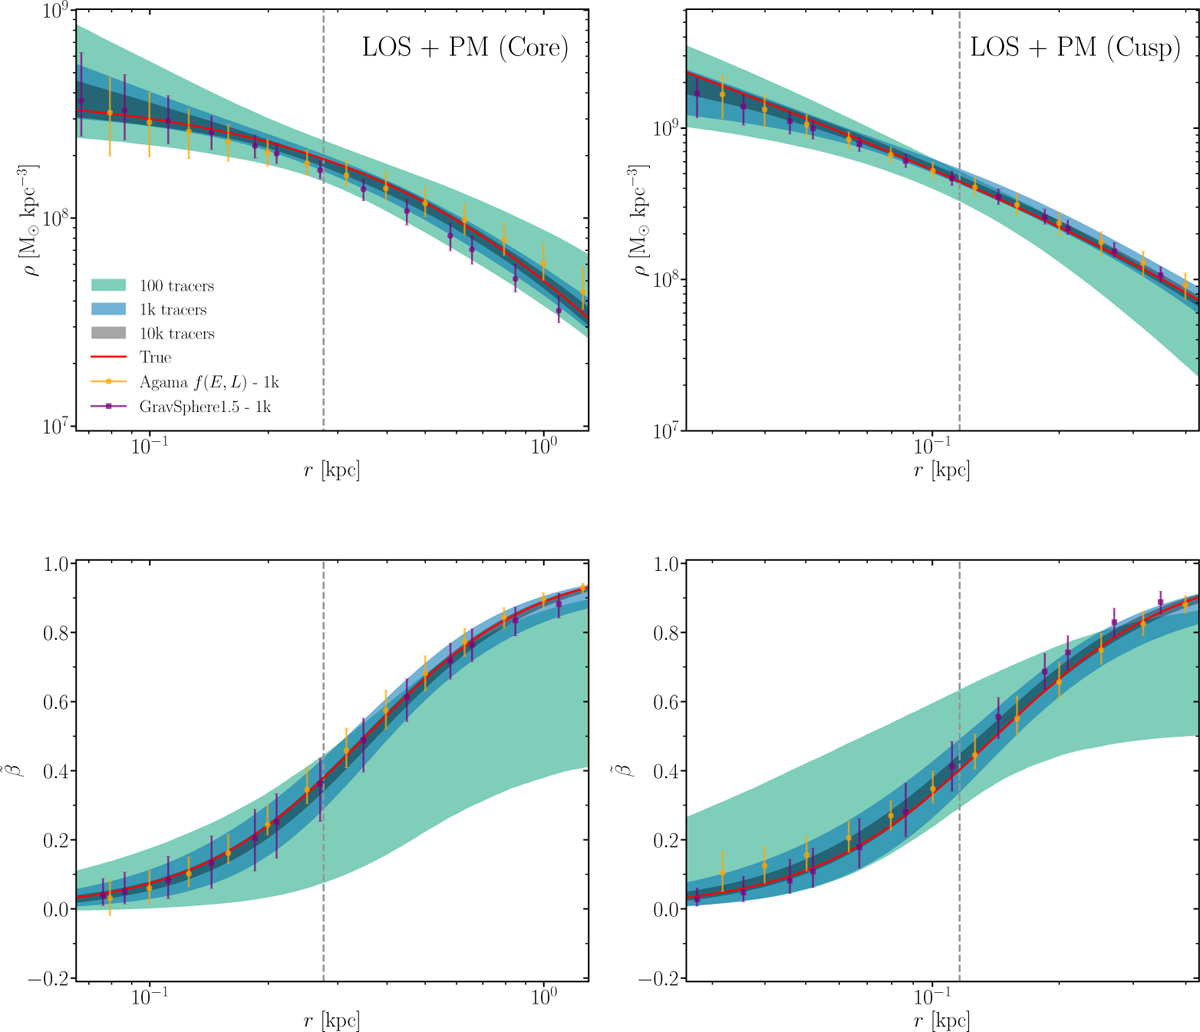
Top-left: 3D dark matter density profile for the PlumCoreOM mock galaxy, bands denote the 95% CL regions from the median for different numbers of stellar tracers including both LOS and PM velocities. The results from Read et al. (2021) for AGAMA f(E, L) models, and from Collins et al. (2021) for GRAVSPHERE1.5 (including LOS VSPs) for 1000 tracers with their respective median values with 95% CL errors are shown for comparison. The red line denotes the true analytical solution from which the mock was generated. The gray, dashed line corresponds to the projected half-light radius (R1/2). Top-right: same as the left hand side but for the PlumCuspOM model. Bottom-left: symmetrized anisotropy profile for the PlumCoreOM model. The red line again denotes the true solution from which the mock was generated, corresponding to an Osipkov-Merritt profile. Lower right: same as the left hand side but for the PlumCuspOM model.
Current usage metrics show cumulative count of Article Views (full-text article views including HTML views, PDF and ePub downloads, according to the available data) and Abstracts Views on Vision4Press platform.
Data correspond to usage on the plateform after 2015. The current usage metrics is available 48-96 hours after online publication and is updated daily on week days.
Initial download of the metrics may take a while.