Fig. B.2
Download original image
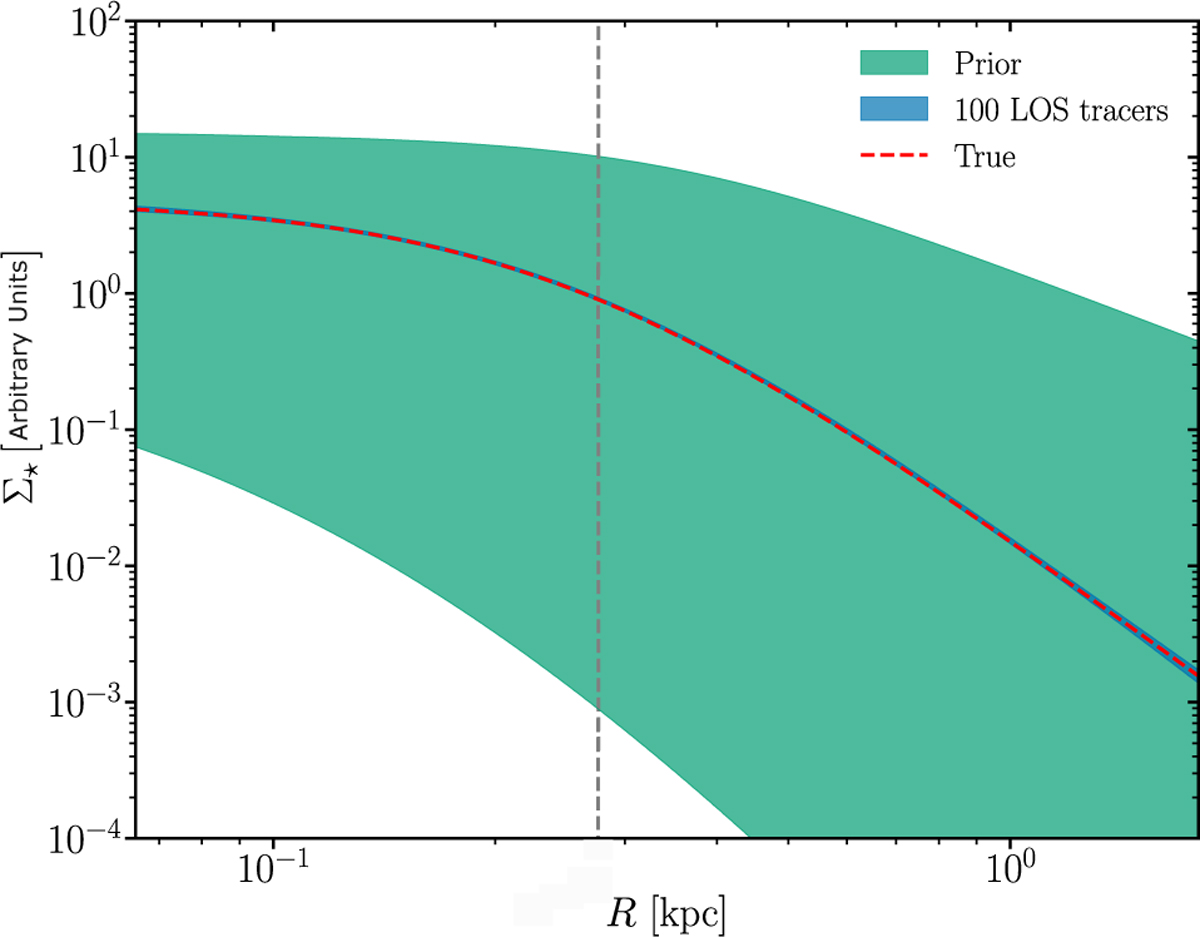
Comparison of GRAVSPHERE2 recovery (95% CL from the median) with just 100 LOS tracers (10,000 for the binned photometric component) and the range spanned by the priors on the tracer surface density model for the PlumCoreOM mock galaxy from the Gaia Challenge suite (same as in Fig. 3).
Current usage metrics show cumulative count of Article Views (full-text article views including HTML views, PDF and ePub downloads, according to the available data) and Abstracts Views on Vision4Press platform.
Data correspond to usage on the plateform after 2015. The current usage metrics is available 48-96 hours after online publication and is updated daily on week days.
Initial download of the metrics may take a while.