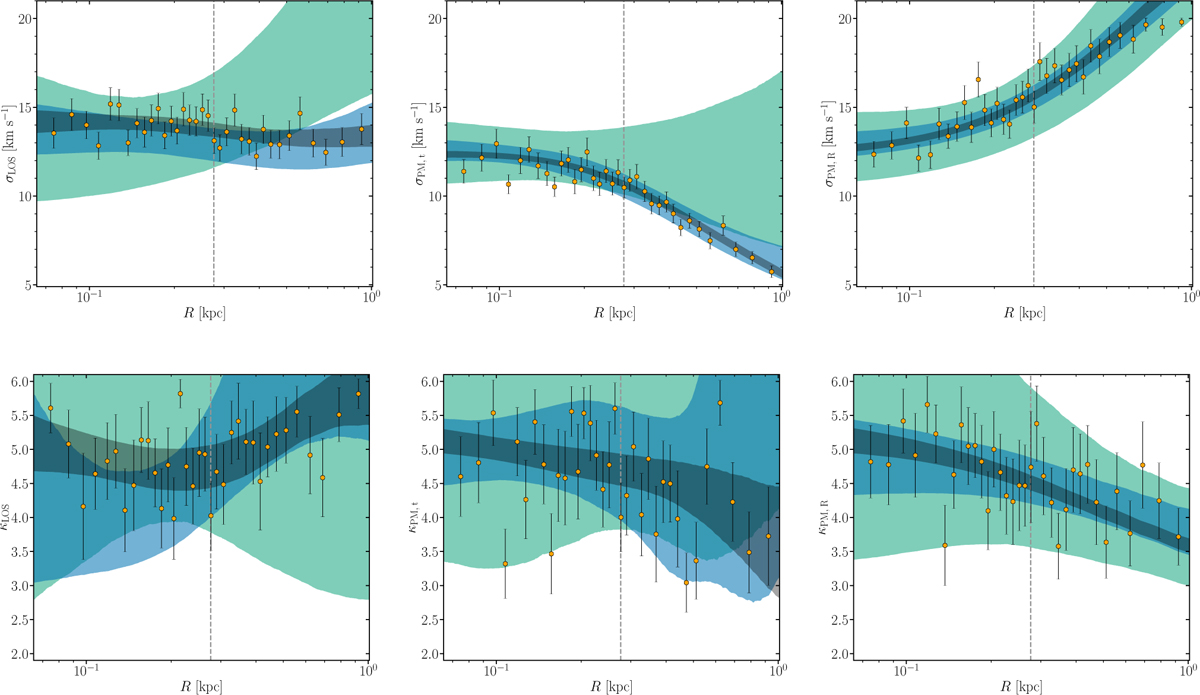
Fig. D.1
Download original image
Projected binned velocity dispersion and kurtosis profiles for the PlumCoreOM GAIA CHALLENGE mock galaxy. LOS and PM velocity dispersion profiles are shown in the upper panels, whilst kurtosis profiles are shown in the bottom ones. The error bars denote 68% CL regions from the median, whilst the colored bands denote the 95% CL regions for 100 (green), 1,000 (blue), and 10,000 (gray) tracers. The LOS profile results are obtained from the LOS-only model, whilst the PM ones combine both data. Binned profiles are for the 10,000 tracer model in bins with an equal number of stars obtained by fitting the generalized PDFs (Eqs. (25) and (30)) for a given variance and kurtosis for each bin. The gray, dashed line denotes the projected half-light radius (R1/2).
Current usage metrics show cumulative count of Article Views (full-text article views including HTML views, PDF and ePub downloads, according to the available data) and Abstracts Views on Vision4Press platform.
Data correspond to usage on the plateform after 2015. The current usage metrics is available 48-96 hours after online publication and is updated daily on week days.
Initial download of the metrics may take a while.