Fig. 3
Download original image
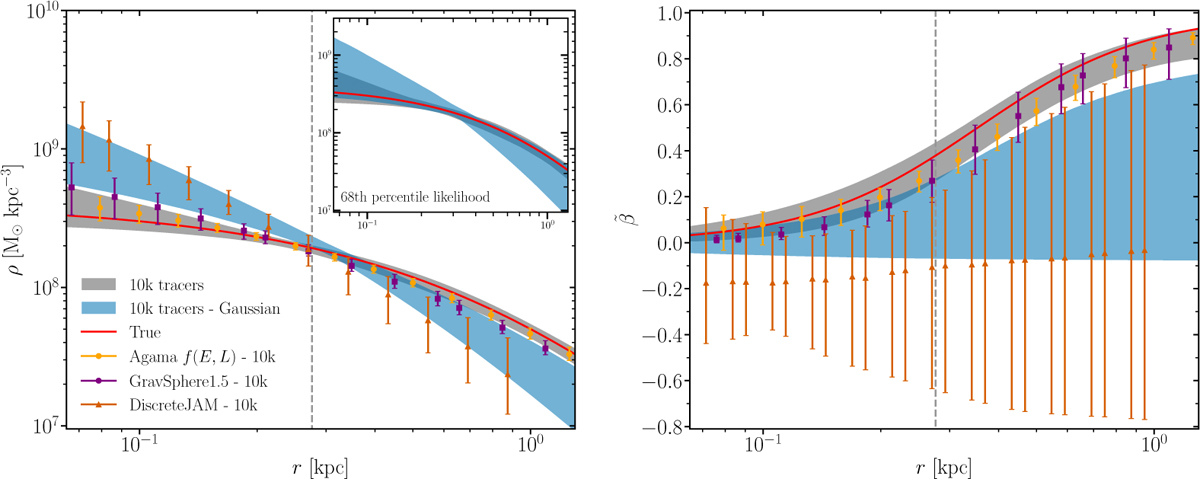
Same as Fig. 2 but for 10 000 tracers in the PlumCoreOM mock, including in the comparison with other models. We have included the DISCRETEJAM results from Read et al. (2021). Left: mass density profiles. Blue band shows our results when Gaussianity is assumed and fourth-order moments are excluded. For comparison, the inset shows instead bands obtained from the posterior distribution of likelihoods when computing extrema of all models falling within the 68th percentile from the maximum likelihood (see text for details). Using this definition, there is a wide range of equally good-fitting models that encompasses the true solution, while the posterior becomes biased due to a relative abundance of cuspier models in the allowable hypervolume. Right: same as left, but for symmetrized anisotropy profile.
Current usage metrics show cumulative count of Article Views (full-text article views including HTML views, PDF and ePub downloads, according to the available data) and Abstracts Views on Vision4Press platform.
Data correspond to usage on the plateform after 2015. The current usage metrics is available 48-96 hours after online publication and is updated daily on week days.
Initial download of the metrics may take a while.