Fig. 5
Download original image
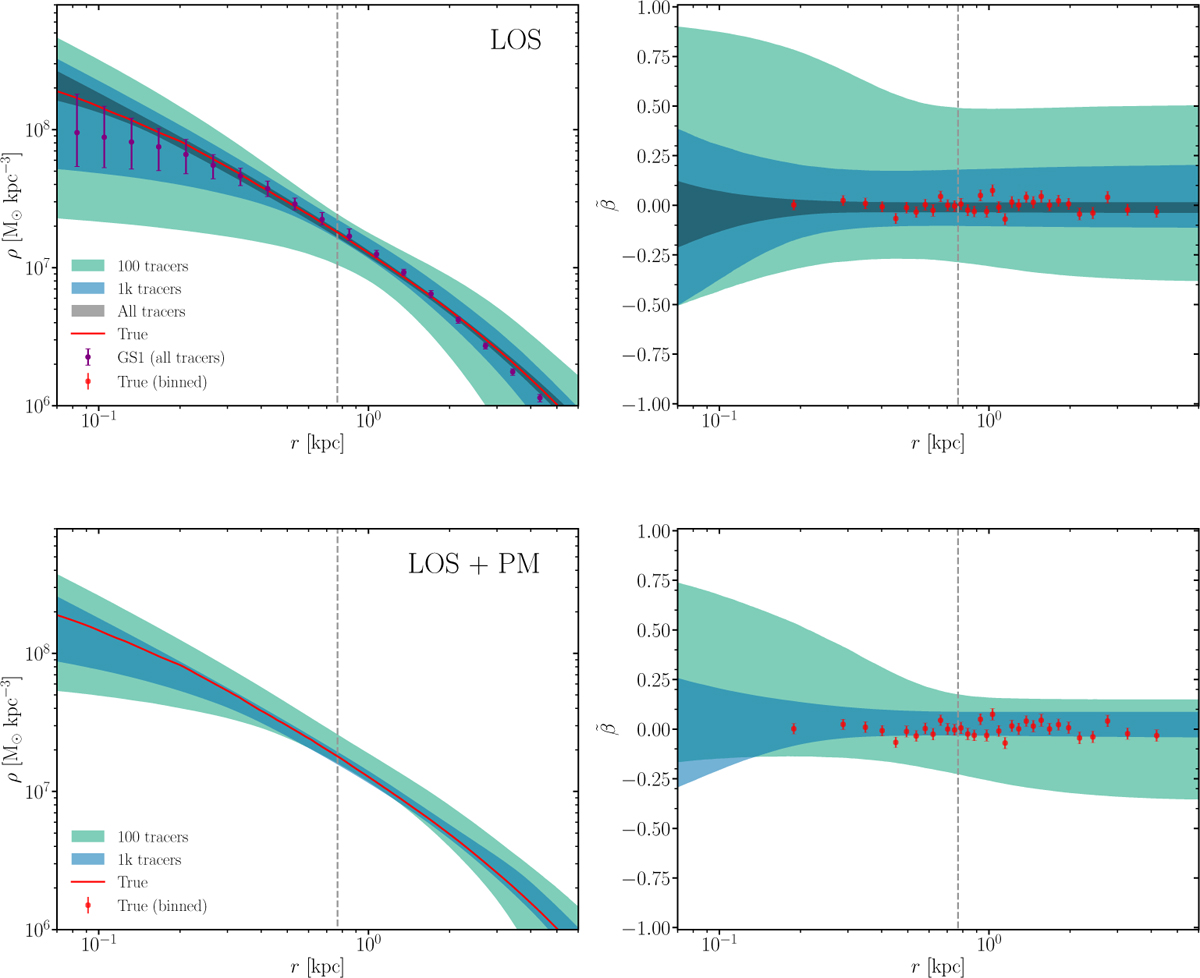
Top-left: GRAVSPHERE2 recovery of the 3D dark matter density profile for the Fornax-like simulated galaxy, where the bands denote the 95% CL regions for different numbers of stellar tracers, as marked, including only LOS velocities. The total sample of bound tracers is 34 158 (gray band). The purple points correspond to the median values with 95% CL errors from Tchiorniy & Genina (2025) using all LOS tracers with GRAVSPHERE1. The red, solid line corresponds to the true density profile from the simulation (smoothened with a Savitzky-Golay filter). The gray, dashed line corresponds to the projected half-light radius (R1/2). Top-right: symmetrized anisotropy profile results. The red points denote the binned 3D anisotropies obtained from bins of equal numbers of tracers and directly fitting the generalized velocity PDF from Eqs. (25) and (30) along the three spherical-coordinate directions. Lower left: same as Upper Left but including both LOS and PM velocities. Lower right: same as Upper Right but with both LOS and PM velocities.
Current usage metrics show cumulative count of Article Views (full-text article views including HTML views, PDF and ePub downloads, according to the available data) and Abstracts Views on Vision4Press platform.
Data correspond to usage on the plateform after 2015. The current usage metrics is available 48-96 hours after online publication and is updated daily on week days.
Initial download of the metrics may take a while.