Fig. 6
Download original image
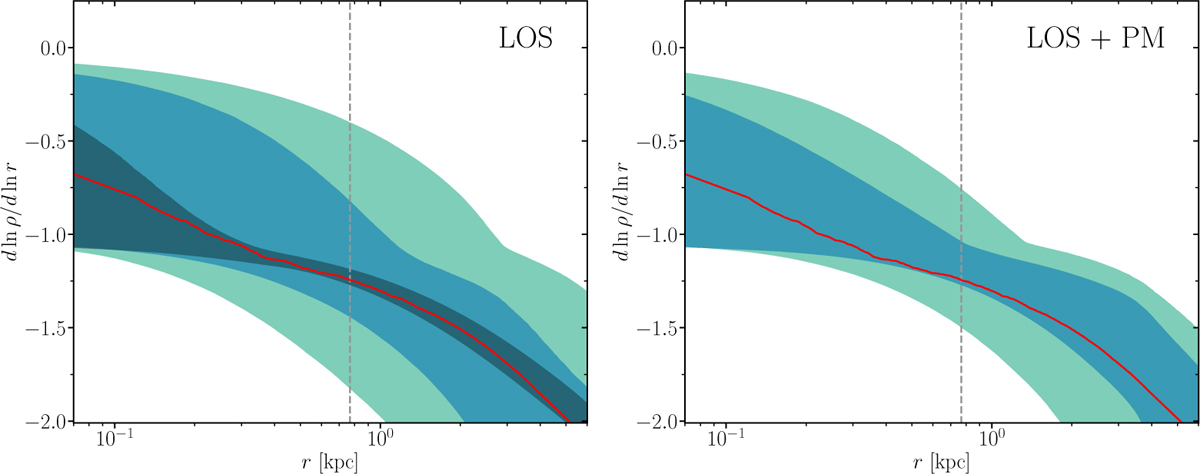
Left: GRAVSPHERE2 recovery of the logarithmic density slope profile for the simulated Fornax-like dwarf. The bands denote the 95% CL regions for different numbers of stellar tracers (100, 1000, and 34 518, same as in Fig. 5) including only LOS velocities, as marked. The red, solid line corresponds to the slope from the smoothened density profile from the simulation. Right: same as the left panel but including both LOS and PM velocities.
Current usage metrics show cumulative count of Article Views (full-text article views including HTML views, PDF and ePub downloads, according to the available data) and Abstracts Views on Vision4Press platform.
Data correspond to usage on the plateform after 2015. The current usage metrics is available 48-96 hours after online publication and is updated daily on week days.
Initial download of the metrics may take a while.