Fig. 2
Download original image
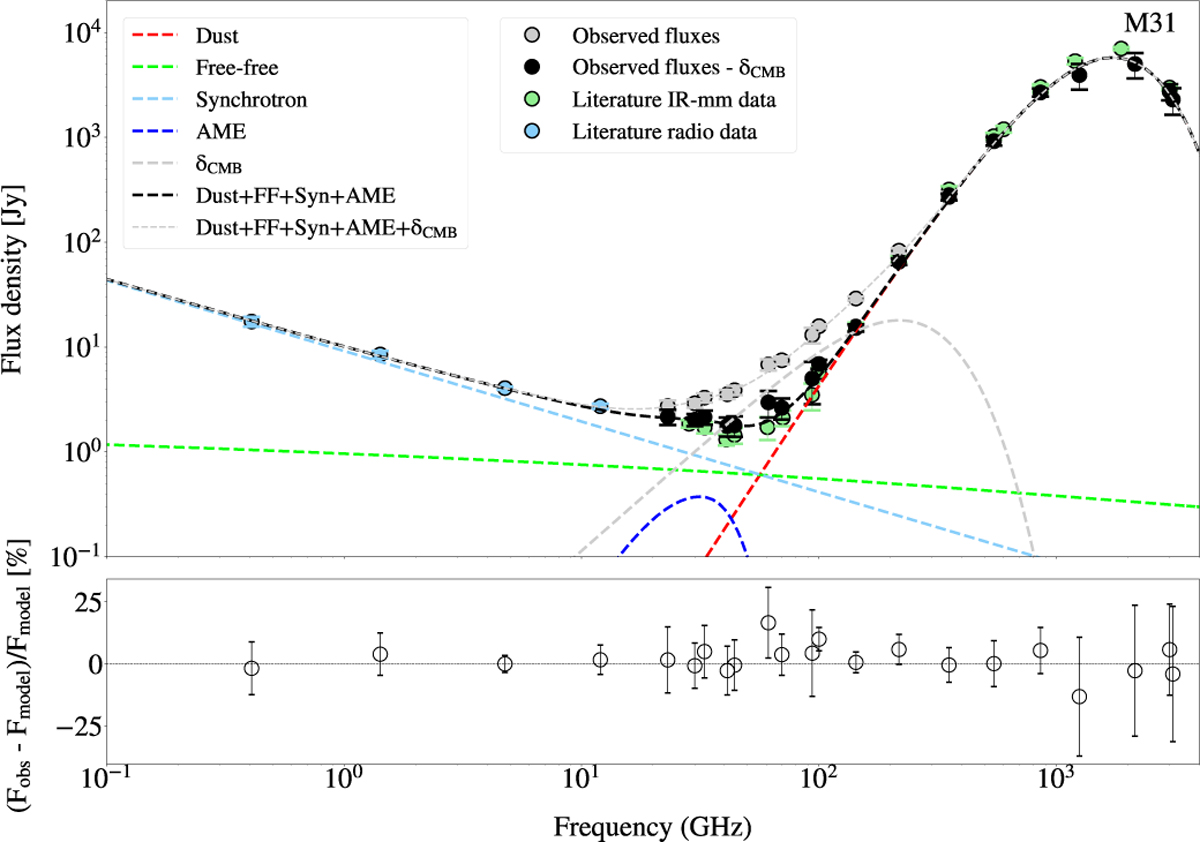
Integrated SED of M31. The gray points represent the flux densities of the galaxy with the CMB fluctuations in the background. This SED was fit with our model, together with the radio data from the literature (blue points). The black points correspond to the flux densities of the galaxy from which the CMB fluctuations were subtracted with the values obtained with the best model of δCMB. The different emission components of our model obtained for the best fit are also represented. The blue points correspond to radio data from the literature. The green points correspond to literature data from Fritz et al. (2012); Bennett et al. (2013); Planck Collaboration Int. XXV (2015). The bottom panel shows residuals between the observed and modeled flux densities of M31.
Current usage metrics show cumulative count of Article Views (full-text article views including HTML views, PDF and ePub downloads, according to the available data) and Abstracts Views on Vision4Press platform.
Data correspond to usage on the plateform after 2015. The current usage metrics is available 48-96 hours after online publication and is updated daily on week days.
Initial download of the metrics may take a while.