Fig. 4
Download original image
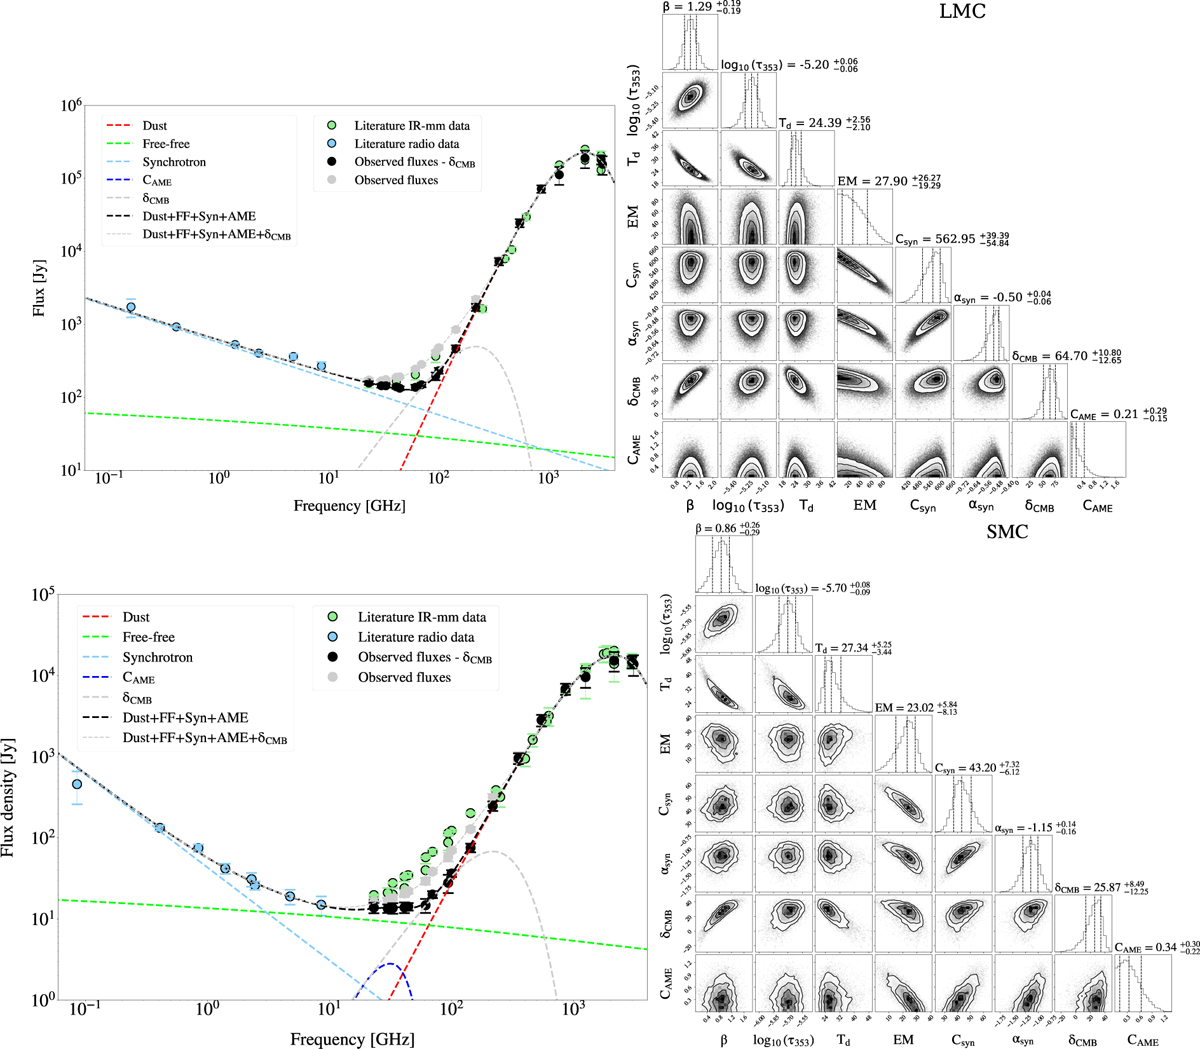
SEDs of the LMC (top) and SMC (bottom) as observed with gray points and without the CMB with black points (subtracted from the best model), and radio data in light blue (from Table A.1 for the LMC and Table A.2 for the SMC). The data points from the literature (Israel et al. 2010; Planck Collaboration XVII 2011) are overlaid in green. The best-fit model spectra are overlaid for the global model and individual emission components. On the right, the corner plot displays probability distributions of each free parameter of the models. The values of the best-fit parameters obtained with the MCMC are written above each histogram.
Current usage metrics show cumulative count of Article Views (full-text article views including HTML views, PDF and ePub downloads, according to the available data) and Abstracts Views on Vision4Press platform.
Data correspond to usage on the plateform after 2015. The current usage metrics is available 48-96 hours after online publication and is updated daily on week days.
Initial download of the metrics may take a while.