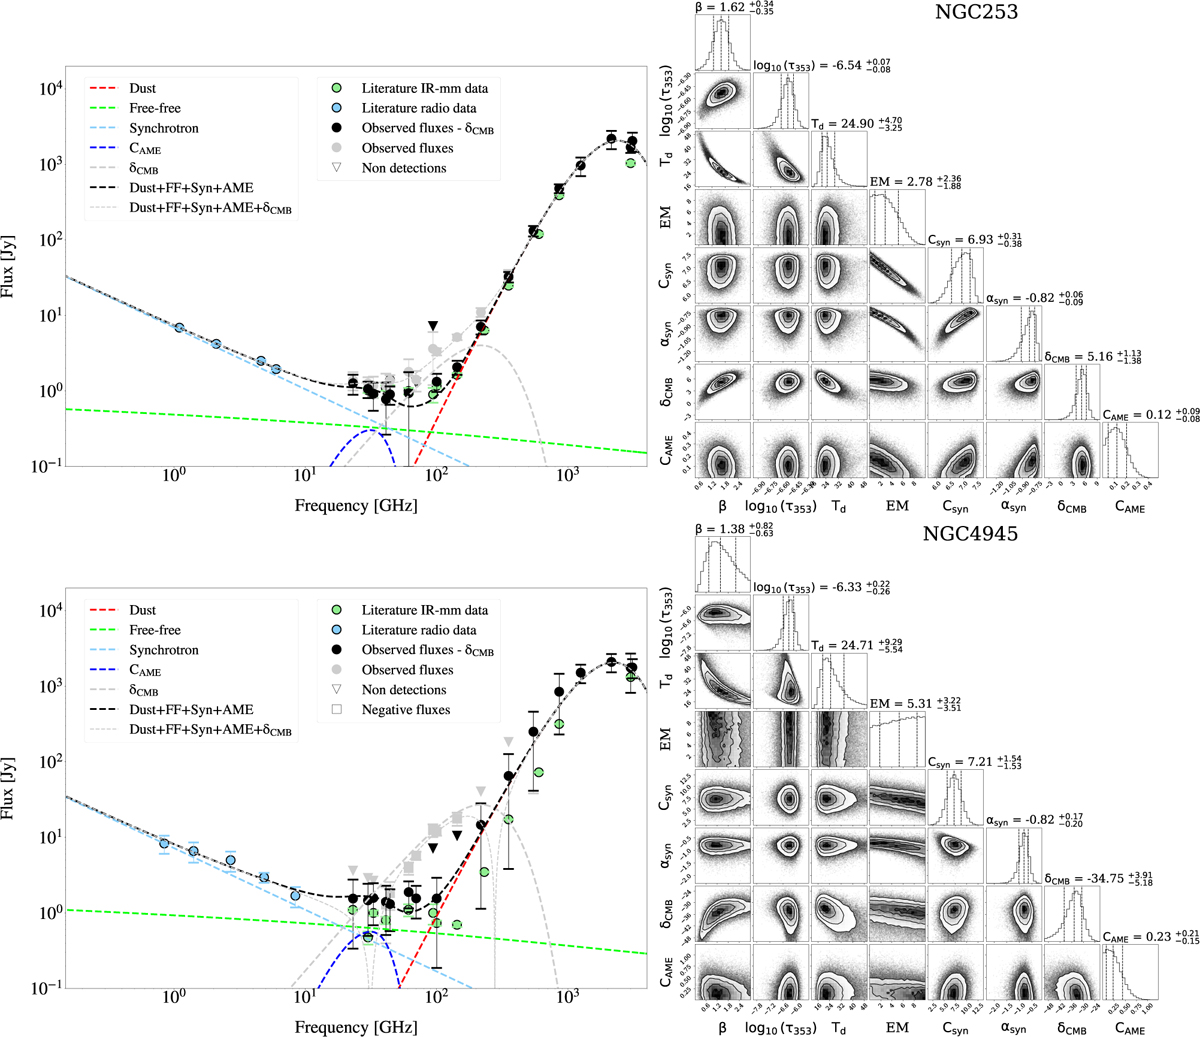
Fig. 6
Download original image
Same as Figure 4 for NGC 253 (top), and NGC 4945 (bottom). Negative values are plotted as squares, using the absolute values of the measured flux densities. Non-detections are represented by upside-down triangles. IR literature data are overlaid in green (Clark et al. 2018), and radio data in light blue (from Tables A.5 for NGC 253 and A.6 for NGC 4945).
Current usage metrics show cumulative count of Article Views (full-text article views including HTML views, PDF and ePub downloads, according to the available data) and Abstracts Views on Vision4Press platform.
Data correspond to usage on the plateform after 2015. The current usage metrics is available 48-96 hours after online publication and is updated daily on week days.
Initial download of the metrics may take a while.