Open Access
Fig. A.1.
Download original image
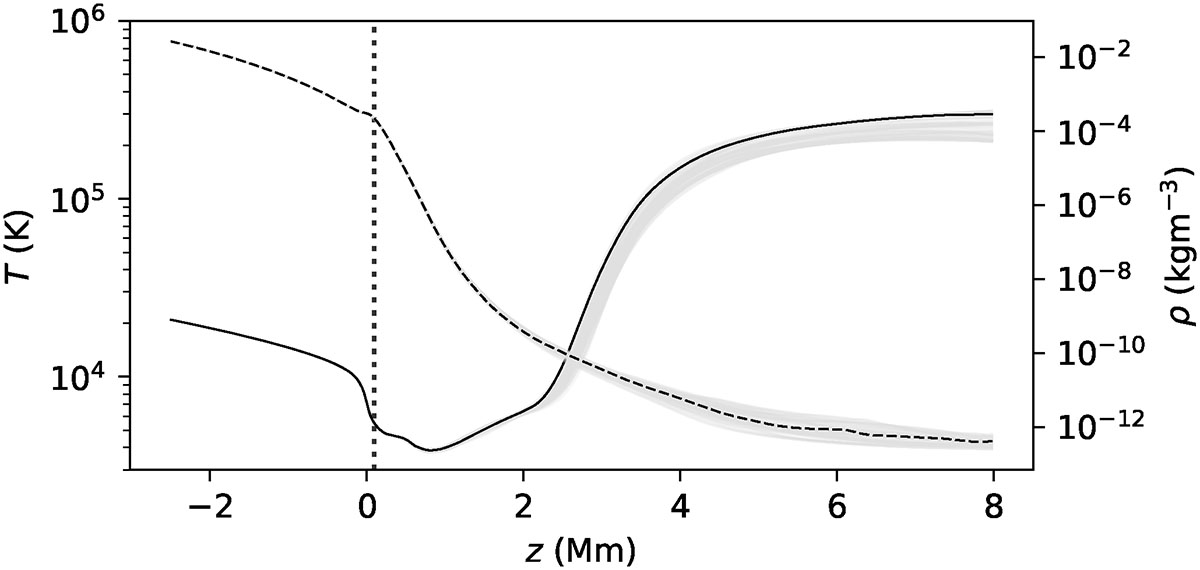
Horizontally averaged temperature (solid) and density (dashed) profiles at each time step used in our simulation (grey). The profiles at t = 350 s is overlaid in black. The average height where τ = 1 is represented by the dotted vertical line. Adapted from C25.
Current usage metrics show cumulative count of Article Views (full-text article views including HTML views, PDF and ePub downloads, according to the available data) and Abstracts Views on Vision4Press platform.
Data correspond to usage on the plateform after 2015. The current usage metrics is available 48-96 hours after online publication and is updated daily on week days.
Initial download of the metrics may take a while.