Fig. 2.
Download original image
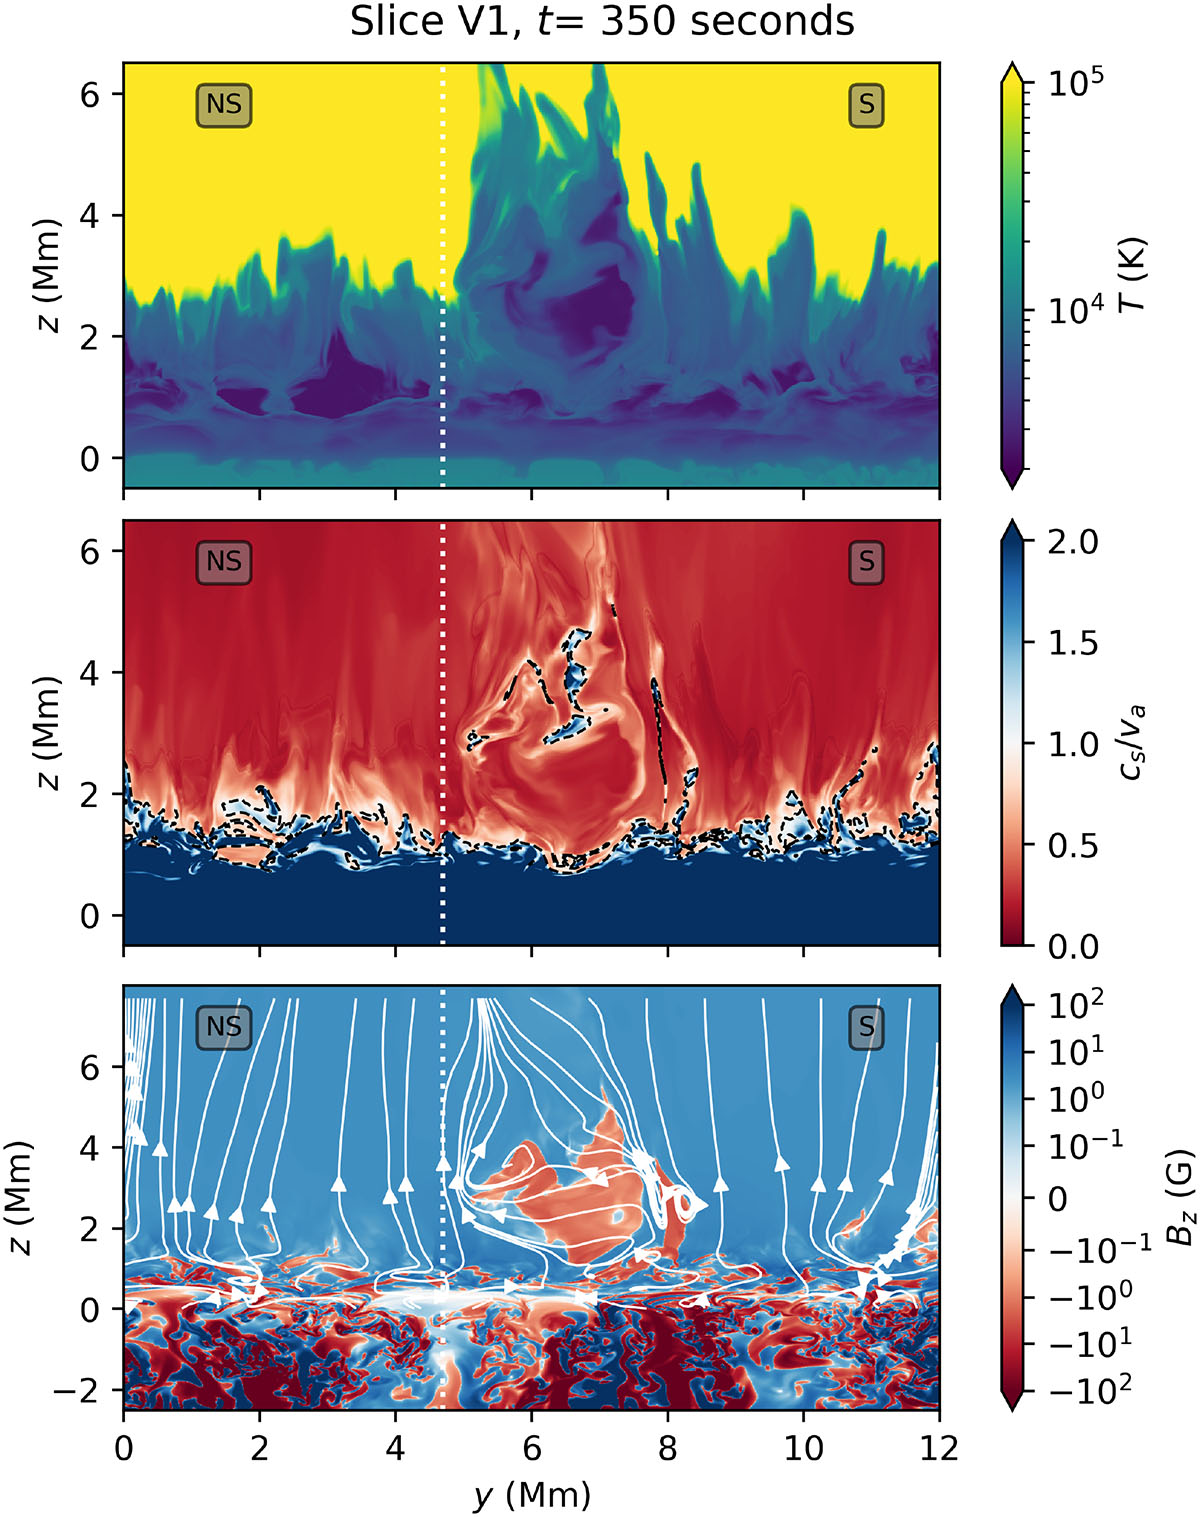
Upper: Temperature plot in vertical slice V1 at time t = 350 s, where the slice intersects the swirl S1. We note the difference in time to Figure 1. The scale is set to highlight the chromospheric plasma showing characteristics of type II spicules. Middle: ratio of sound and Alfvén speeds in slice V1, with the equipartition level (cs/va = 1) outlined by the dashed line. Lower: Structure of the vertical magnetic field, with streamlines overlaid for z > 0 Mm. The vertical dotted line splits the slice into two sections (with the swirl (S), and without the swirl (NS)), which are used for analysis throughout Section 4.
Current usage metrics show cumulative count of Article Views (full-text article views including HTML views, PDF and ePub downloads, according to the available data) and Abstracts Views on Vision4Press platform.
Data correspond to usage on the plateform after 2015. The current usage metrics is available 48-96 hours after online publication and is updated daily on week days.
Initial download of the metrics may take a while.