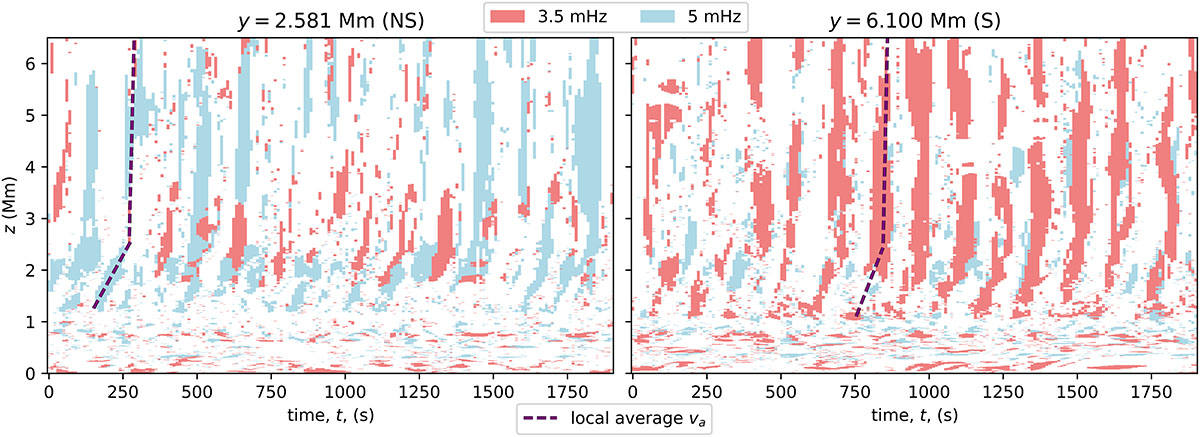
Fig. 6.
Download original image
Time–distance plot of vertical slice V1 at y = 2.6 Mm (left panel, case NS) and y = 6.1 Mm (right panel, case S). See Figure 4 for slice references. MSFs of 3.5 and 5 mHz are displayed for parallel velocity, including harmonics. The dashed lines over-plotted represent the trajectory of an object moving at the Alfvén speed. For this, the average local Alfvén speed is calculated for the specified times for z = 1.5–2.5 Mm, and for z = 2.5–6.5 Mm.
Current usage metrics show cumulative count of Article Views (full-text article views including HTML views, PDF and ePub downloads, according to the available data) and Abstracts Views on Vision4Press platform.
Data correspond to usage on the plateform after 2015. The current usage metrics is available 48-96 hours after online publication and is updated daily on week days.
Initial download of the metrics may take a while.