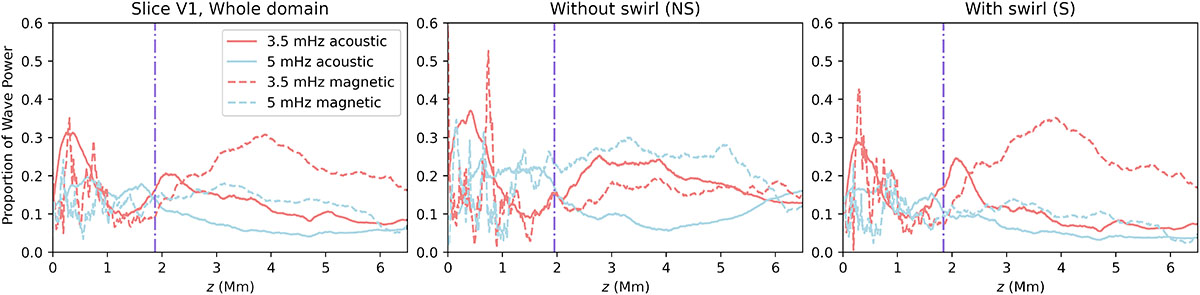
Fig. 8.
Download original image
Proportion of the total time-averaged vertical wave-energy power found at locations of 3.5 mHz and 5 mHz MSFs in the whole domain V1 (left panel) and in the split domain (NS, S) for the presence and absence of a swirl structure (middle and right panels). The dash-dot lines represent the height at which the total magnetic power surpasses the acoustic power in the domain.
Current usage metrics show cumulative count of Article Views (full-text article views including HTML views, PDF and ePub downloads, according to the available data) and Abstracts Views on Vision4Press platform.
Data correspond to usage on the plateform after 2015. The current usage metrics is available 48-96 hours after online publication and is updated daily on week days.
Initial download of the metrics may take a while.