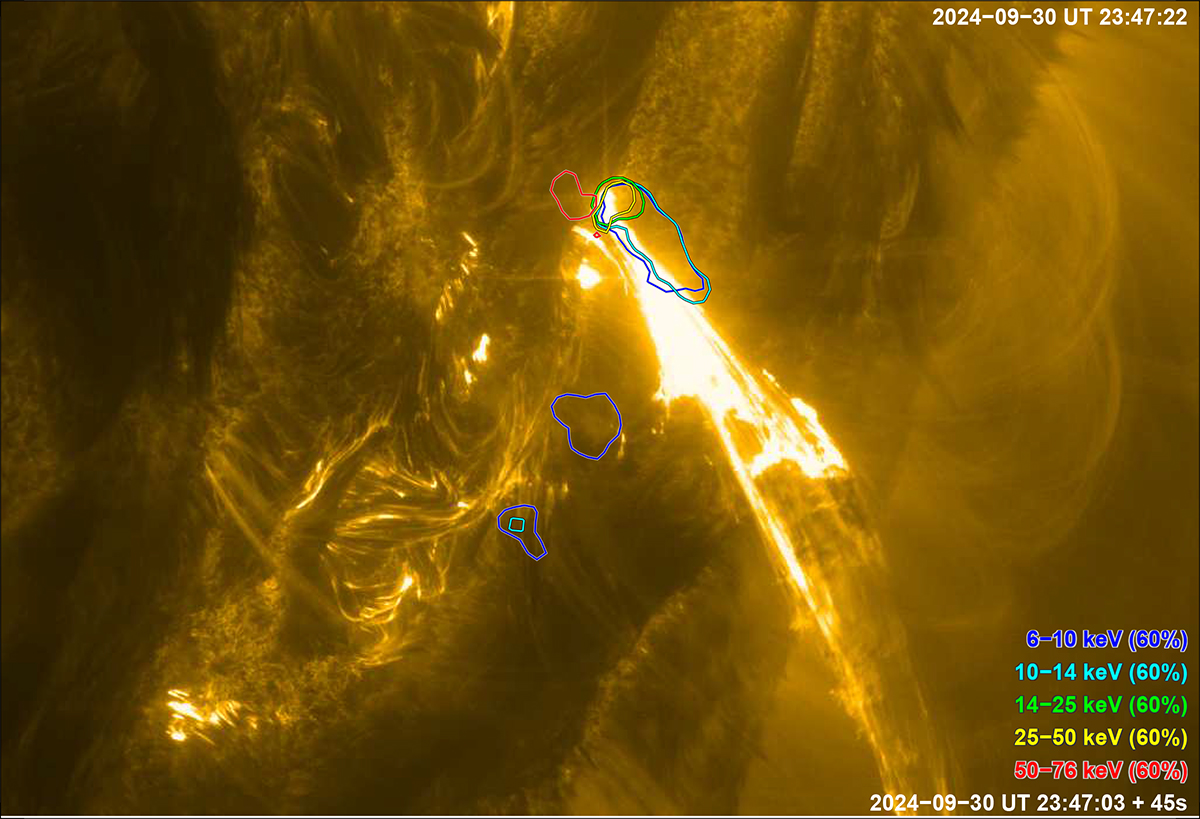
Fig. 1.
Download original image
Coronal overview of the impulsive phase of an M-class flare that started around 23:47 UT, observed by Solar Orbiter. The HRIEUV map of the flaring region is displayed (its time stamp with universal time, UT, measured at Earth is shown at the top right corner). The field of view is roughly 107 Mm × 71 Mm. The overlaid colored contours identify the STIX hard X-ray source regions in the respective energy bins as labeled. The STIX images were constructed by integrating the signal over the time frame quoted at the bottom right. The contours are at a level of 60% of the maximum of the corresponding STIX images. An animated version of this figure is shown in movie S1.
Current usage metrics show cumulative count of Article Views (full-text article views including HTML views, PDF and ePub downloads, according to the available data) and Abstracts Views on Vision4Press platform.
Data correspond to usage on the plateform after 2015. The current usage metrics is available 48-96 hours after online publication and is updated daily on week days.
Initial download of the metrics may take a while.