Fig. A.5.
Download original image
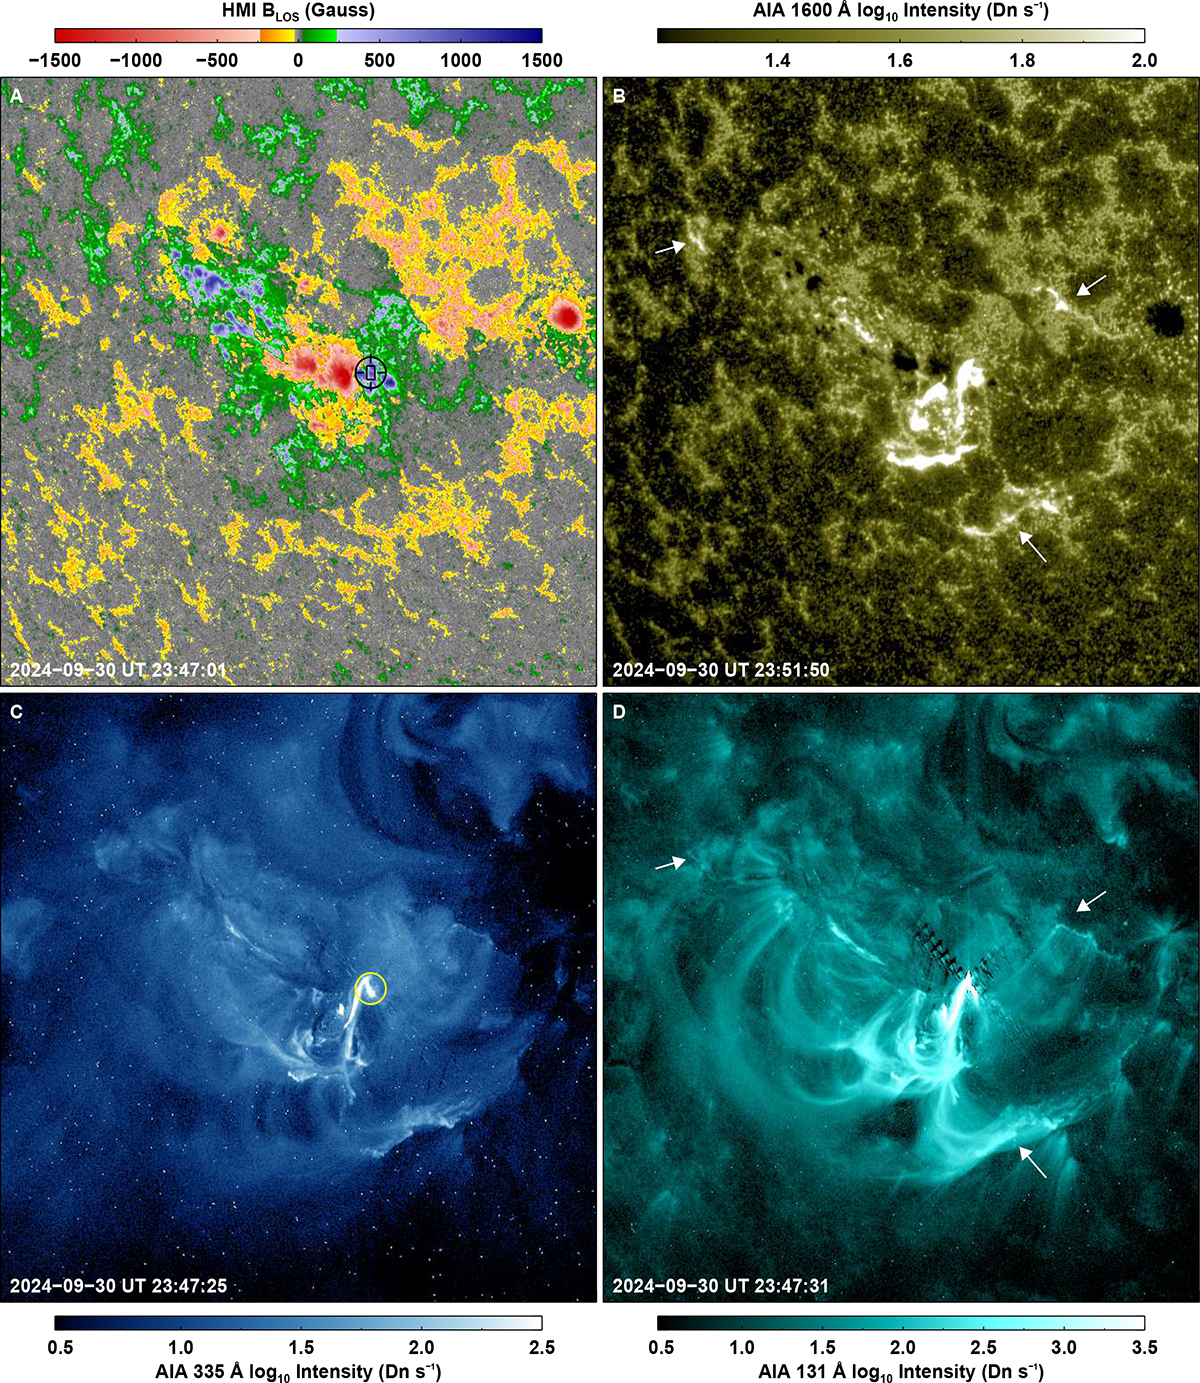
Overview of the flaring regions as seen by the Solar Dynamics Observatory. (A) HMI line of sight magnetic field map saturated at ±1500 G. The black cross-hair with an enclosed rectangle marks the surface footpoint of the unstable filament. (B) AIA 1600 Å map showing the central brighter flare ribbons along with fainter remote brightenings associated with the event (pointed at by the white arrows). (C) and (D) AIA 335 Å and 131 Å images displaying the overlying coronal structures. In (C) the yellow circle outlines the filament footpoint. The three arrows in (D) point to the footpoints of coronal loops connected to the flaring site and the remote brightenings.
Current usage metrics show cumulative count of Article Views (full-text article views including HTML views, PDF and ePub downloads, according to the available data) and Abstracts Views on Vision4Press platform.
Data correspond to usage on the plateform after 2015. The current usage metrics is available 48-96 hours after online publication and is updated daily on week days.
Initial download of the metrics may take a while.