Fig. B.1.
Download original image
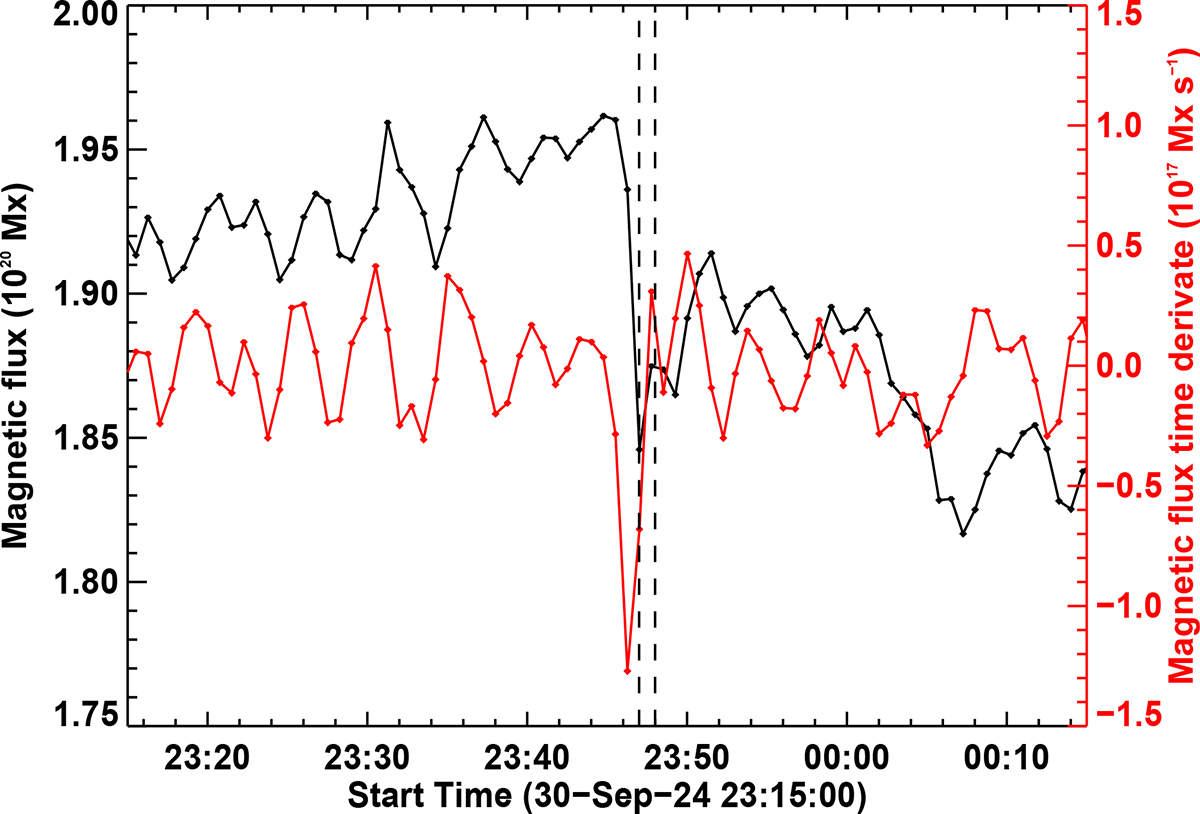
Photospheric magnetic imprints of the flare. Black curve shows the time series of the magnetic flux computed from the integration of the line of sight magnetic field component over the black rectangle in Fig. A.5A. Red curve is its time derivative. The vertical dashed lines mark the duration of the HXR impulsive phase of the flare.
Current usage metrics show cumulative count of Article Views (full-text article views including HTML views, PDF and ePub downloads, according to the available data) and Abstracts Views on Vision4Press platform.
Data correspond to usage on the plateform after 2015. The current usage metrics is available 48-96 hours after online publication and is updated daily on week days.
Initial download of the metrics may take a while.