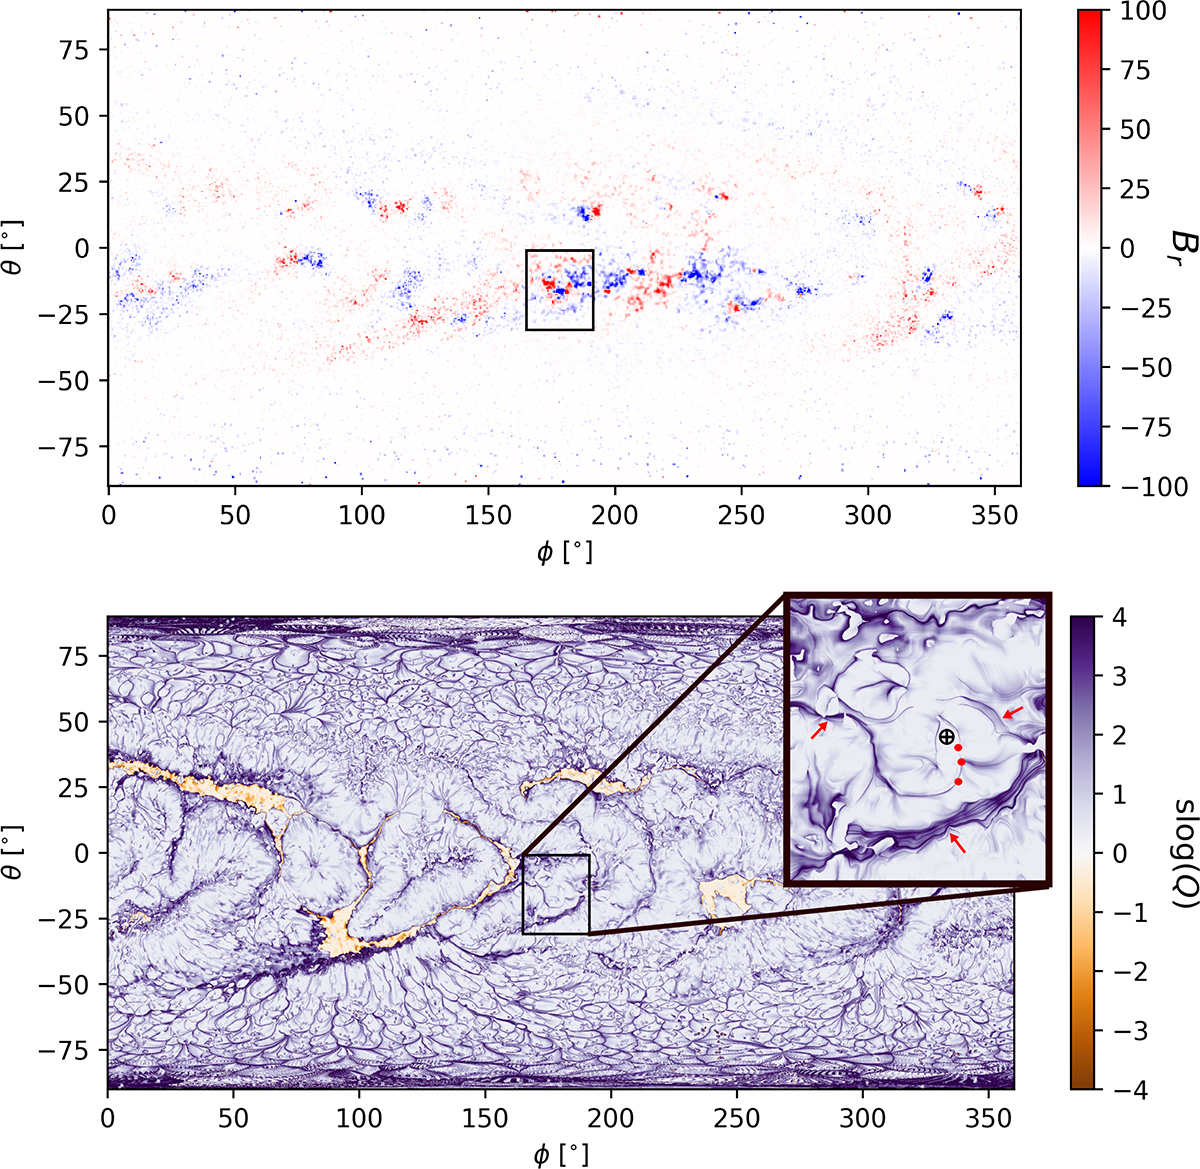
Fig. B.2.
Download original image
Large-scale magnetic overview of the flaring region. Top panel is the radial magnetic field map of the full Sun in Carrington longitude and latitude coordinate system (saturated to ±100 G). The black rectangle identifies the active region in which the flare was triggered. The lower panel shows the signed-log (slog) of the magnetic squashing factor, Q. In the inset the latitude and longitude positions of the three magnetic nulls are marked with red circles. The black cross-hair is roughly at the same location as that in Fig. A.5A. The red arrows point to the locations of remote brightenings (as those marked in Fig. A.5).
Current usage metrics show cumulative count of Article Views (full-text article views including HTML views, PDF and ePub downloads, according to the available data) and Abstracts Views on Vision4Press platform.
Data correspond to usage on the plateform after 2015. The current usage metrics is available 48-96 hours after online publication and is updated daily on week days.
Initial download of the metrics may take a while.