Fig. B.3.
Download original image
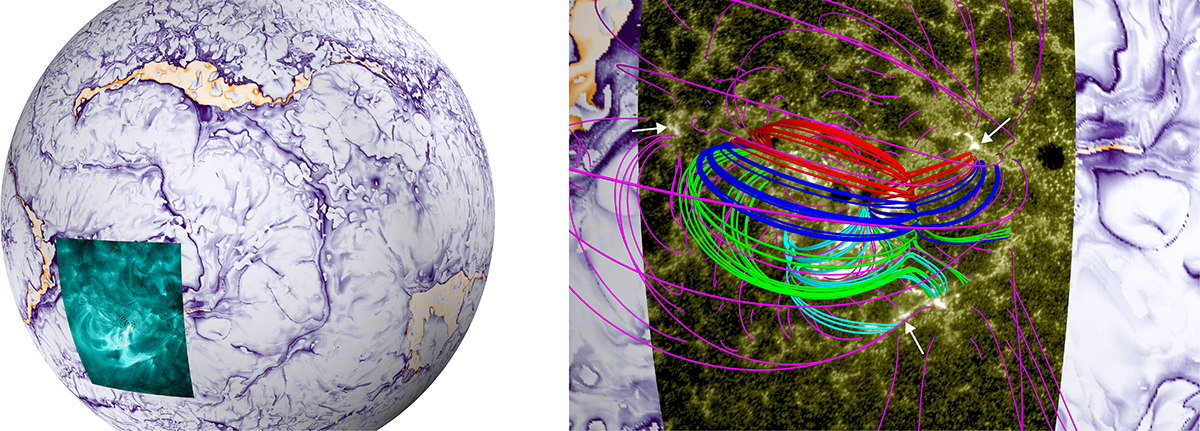
Large-scale magnetic connectivity linked to the flaring region. In the left panel, we display the spherical rendering of the slog Q plotted in Fig. A.7. The sphere is overlaid with the SDO AIA 131 Å emission map highlighting the bright flaring region (same as in Fig. A.5D). In the right panel we zoom closer to the flaring region and overlay AIA 1600 Å map (same as in Fig. A.5B) on the slog Q sphere. The three white arrows point to the remote brightenings. The red, blue, and green field lines are associated with the northern, central and southern null points shown in Fig. A.7. The cyan and magenta colored field lines trace some low-lying and high-altitude field structures, all closely linked to the flaring region.
Current usage metrics show cumulative count of Article Views (full-text article views including HTML views, PDF and ePub downloads, according to the available data) and Abstracts Views on Vision4Press platform.
Data correspond to usage on the plateform after 2015. The current usage metrics is available 48-96 hours after online publication and is updated daily on week days.
Initial download of the metrics may take a while.