Fig. 2.
Download original image
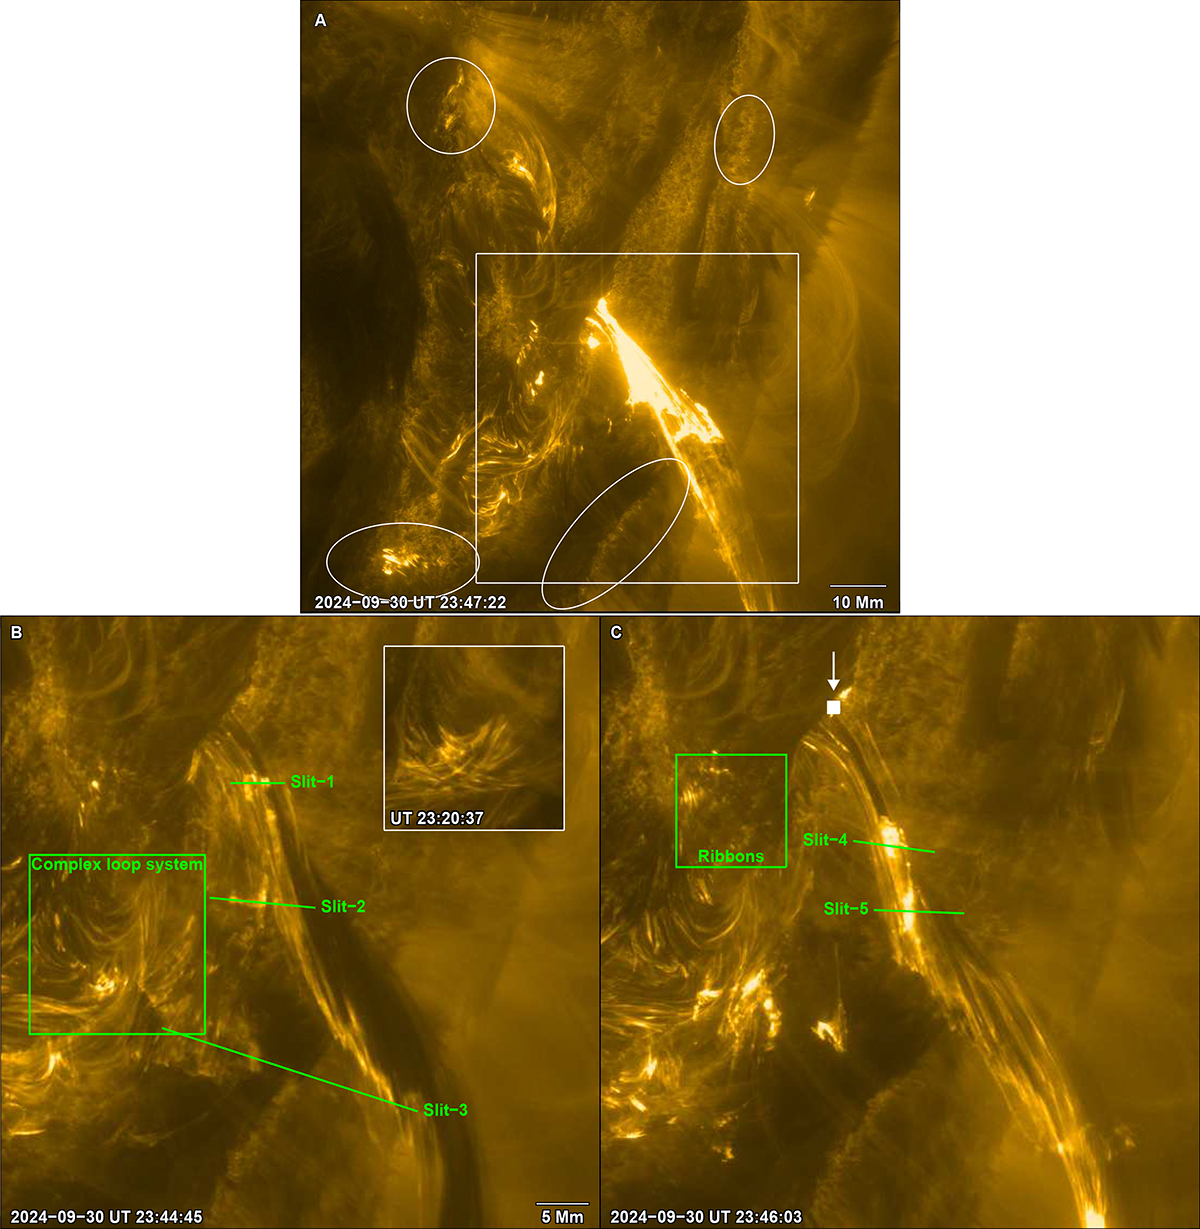
Locations of various slits, loops, and the ribbon region. In the upper panel, a larger field of view of HRIEUV covering the flare is shown. The white square outlines the smaller field of view shown in the lower panels. The four ellipses point to remote ribbon brightenings connected to the flare itself. In the lower panels, Slits 1–5 mark the positions of the artificial slits that we used to construct the five time-distance diagrams shown in Fig. 4. Slits 1–3 (lower left panel) cover specific regions where the unstable filament gets disconnected from the underlying complex loop system. Slits 4–5 (lower right panel) mark regions where the unstable filament exhibits fast unwinding motions. The green box in the lower left panel shows the field of view of the complex loop system in Fig. 3, while in the lower right panel it outlines the flare ribbon maps plotted in Fig. 5. The filled white box (indicated by an arrow) is the location from where we derived the time series of the mean HRIEUV intensity shown in Fig. 4E. An animated version of the upper panel is shown in movie S2.
Current usage metrics show cumulative count of Article Views (full-text article views including HTML views, PDF and ePub downloads, according to the available data) and Abstracts Views on Vision4Press platform.
Data correspond to usage on the plateform after 2015. The current usage metrics is available 48-96 hours after online publication and is updated daily on week days.
Initial download of the metrics may take a while.