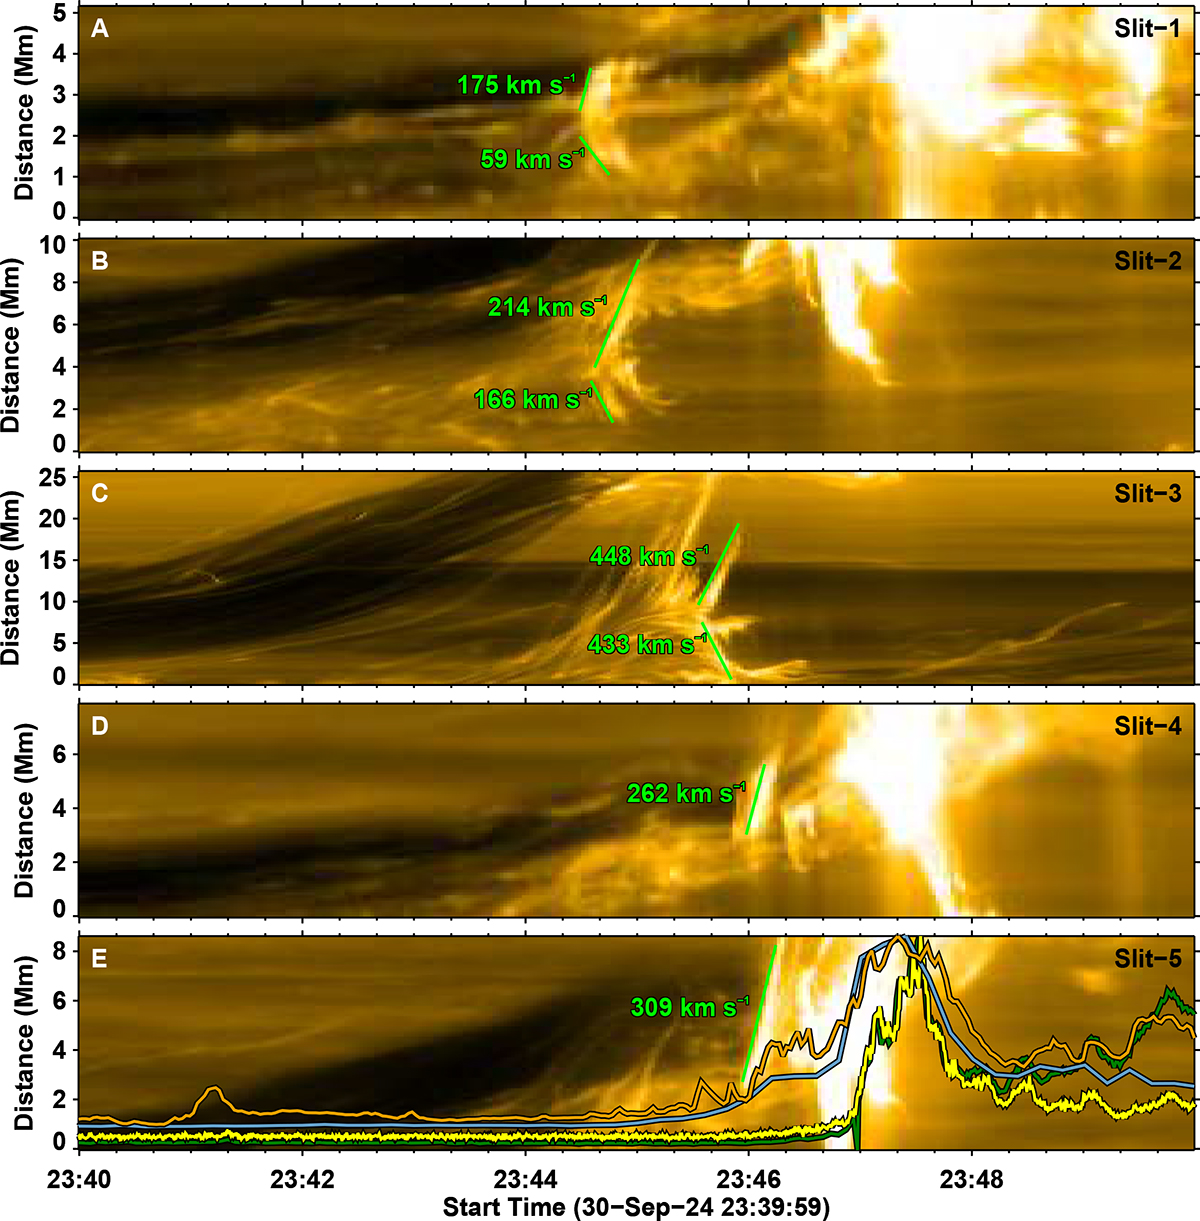
Fig. 4.
Download original image
Prominent magnetic activity over the course of two minutes during the pre-flare phase leading up to the flare, which started around 23:47 UT. Similar to Fig. 3C, we plotted the time-distance diagrams to capture the prominent coronal dynamics just before the flare. The positions of slits 1–5 are marked in Fig. 2. The speeds of reconnection flows along the slit are given. In panel E we plot the time series of EUV emission (gold, HRIEUV; blue, SDO/AIA 335 Å) emerging from the foot region of the flaring flux rope. The foot region in the EUI images is outlined by the 25–50 keV contour in Fig. 1 (see the white box in Fig. 2 and the yellow circle in Fig. A.5). The hard X-ray emission time series in the 25–50 keV energy range is also shown (yellow, STIX; dark green, Fermi Gamma Ray Burst Monitor).
Current usage metrics show cumulative count of Article Views (full-text article views including HTML views, PDF and ePub downloads, according to the available data) and Abstracts Views on Vision4Press platform.
Data correspond to usage on the plateform after 2015. The current usage metrics is available 48-96 hours after online publication and is updated daily on week days.
Initial download of the metrics may take a while.