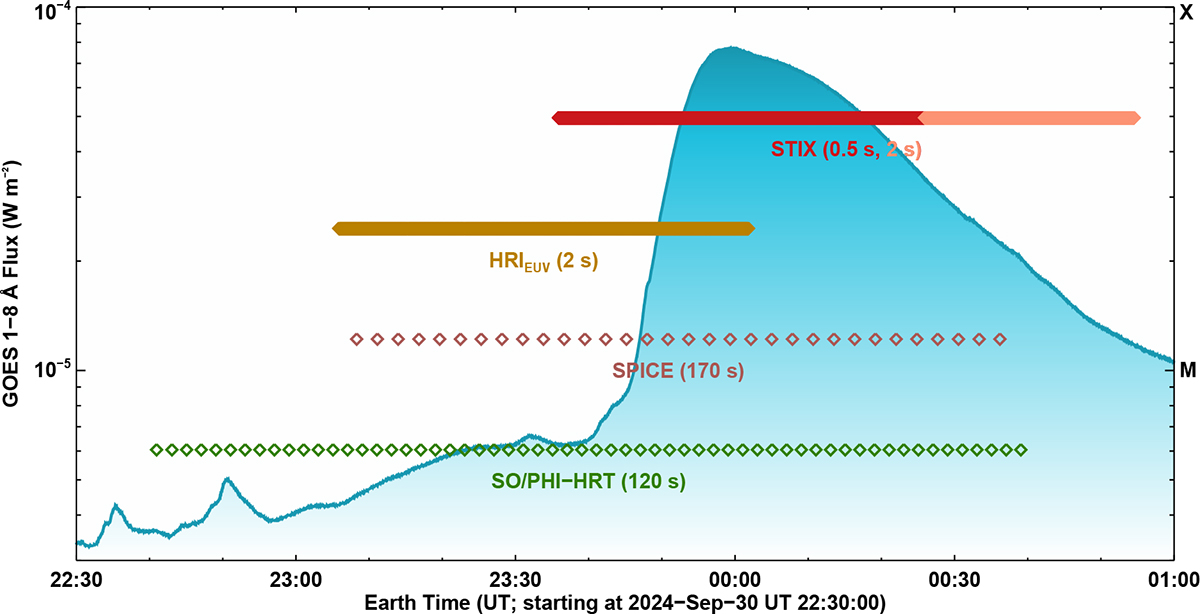
Fig. A.1.
Download original image
Overview of Solar Orbiter observations. Temporal coverage of the data and the corresponding cadence from the four remote-sensing instruments on board the Solar Orbiter spacecraft used in this study. In the case of STIX data, the darker red line denotes the observations at 0.5 s cadence while the lighter red line indicates 2 s cadence. The background shaded curve is the sun-as-a-star time series of the soft X-ray flux in the 1–8 Å filter on the Geostationary Operational Environmental Satellite. The right hand side ordinate gives the flare classification scale.
Current usage metrics show cumulative count of Article Views (full-text article views including HTML views, PDF and ePub downloads, according to the available data) and Abstracts Views on Vision4Press platform.
Data correspond to usage on the plateform after 2015. The current usage metrics is available 48-96 hours after online publication and is updated daily on week days.
Initial download of the metrics may take a while.