Open Access
Fig. A.2.
Download original image
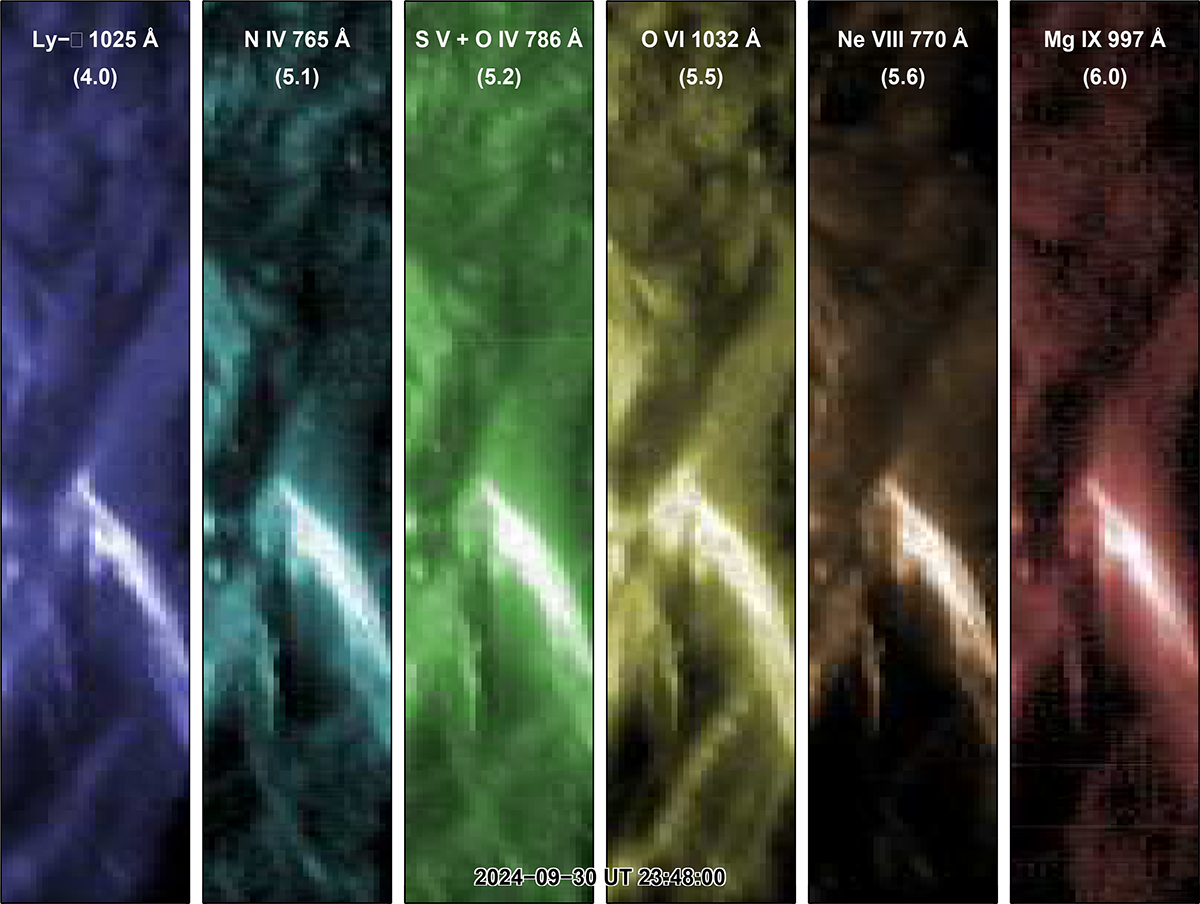
Multi-thermal characteristics of the flare. SPICE observations of the flare sampled by different spectral lines, where the numbers in the parenthesis indicate the logarithmic value of the line formation temperature (in K). An animated version of this figure is shown in movie S6.
Current usage metrics show cumulative count of Article Views (full-text article views including HTML views, PDF and ePub downloads, according to the available data) and Abstracts Views on Vision4Press platform.
Data correspond to usage on the plateform after 2015. The current usage metrics is available 48-96 hours after online publication and is updated daily on week days.
Initial download of the metrics may take a while.