Fig. A.3.
Download original image
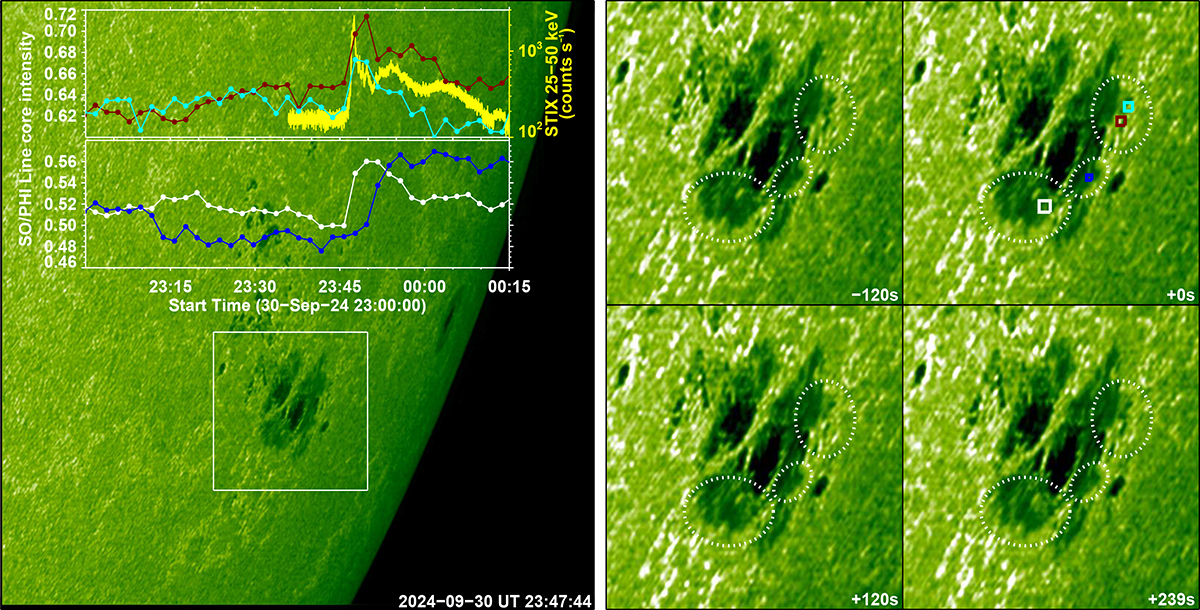
Photospheric imprints of the flare. Background image in the left panel is the full field-of-view SO/PHI High Resolution Telescope (HRT) line-core intensity map obtained close in time to the impulsive phase of the flare. A sequence of four images from the sub field-of-view outlined by the white square, each separated by 120 s, are plotted in the right panel. The three dotted ellipses mark regions where we observed flare-related line-core intensity enhancements. Some of the pixels exhibiting clear intensity enhancements are marked by the cyan, maroon, blue and white colored boxes on the top right image. Time series of the intensity averaged over these regions are shown as the respective colored light curves overlaid on the left panel. The yellow colored curve in the upper panel of these time series plots is the STIX count rates in the 25 keV to 50 keV energy bin (background not subtracted), as a function of time. An animated version of this figure is shown in movie S7.
Current usage metrics show cumulative count of Article Views (full-text article views including HTML views, PDF and ePub downloads, according to the available data) and Abstracts Views on Vision4Press platform.
Data correspond to usage on the plateform after 2015. The current usage metrics is available 48-96 hours after online publication and is updated daily on week days.
Initial download of the metrics may take a while.