Fig. A.4.
Download original image
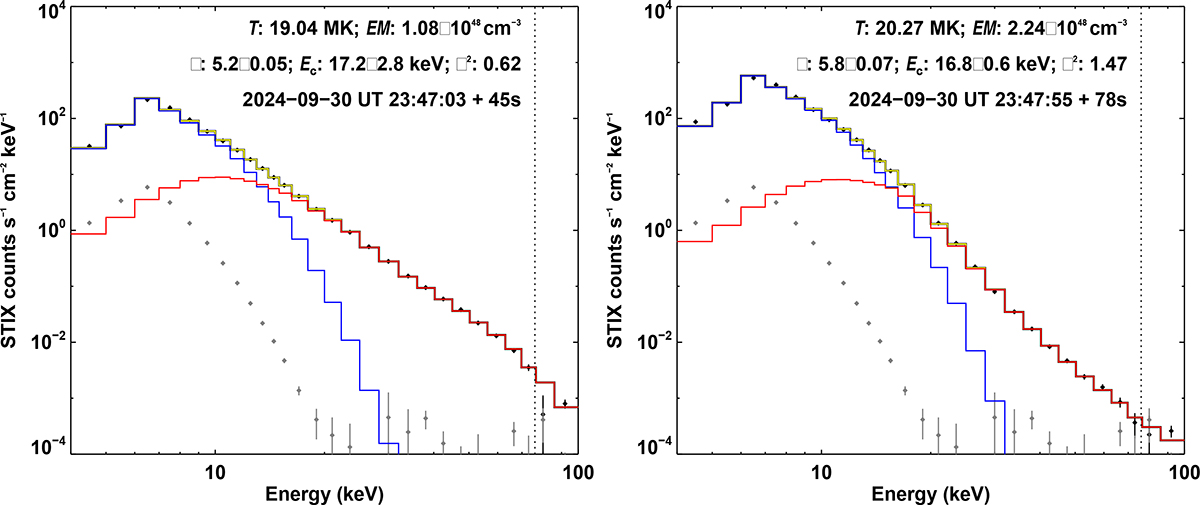
Thermal and nonthermal characteristics of the flare. Left: black symbols with 1σ uncertainties show the observed background-subtracted STIX spectrum. The gray symbols with 1σ uncertainties denote the background spectrum. Thermal (blue) and thick-target (red) models fitted to the observations are over-plotted. The yellow curve is the total of the two models. The vertical dotted lines indicate the upper limit of the energy that we considered to fit the models. Various fit parameters (temperature T, emission measure EM, electron spectral index δ, low-energy cutoff Ec, and goodness of the fit χ2) are quoted. Time period over which the STIX spectrum is integrated is also mentioned. Right: same as the left panel but plotted for a post-impulsive phase STIX spectrum fitted by a combination of thermal (blue) and thin-target (red) models.
Current usage metrics show cumulative count of Article Views (full-text article views including HTML views, PDF and ePub downloads, according to the available data) and Abstracts Views on Vision4Press platform.
Data correspond to usage on the plateform after 2015. The current usage metrics is available 48-96 hours after online publication and is updated daily on week days.
Initial download of the metrics may take a while.