Fig. 2.
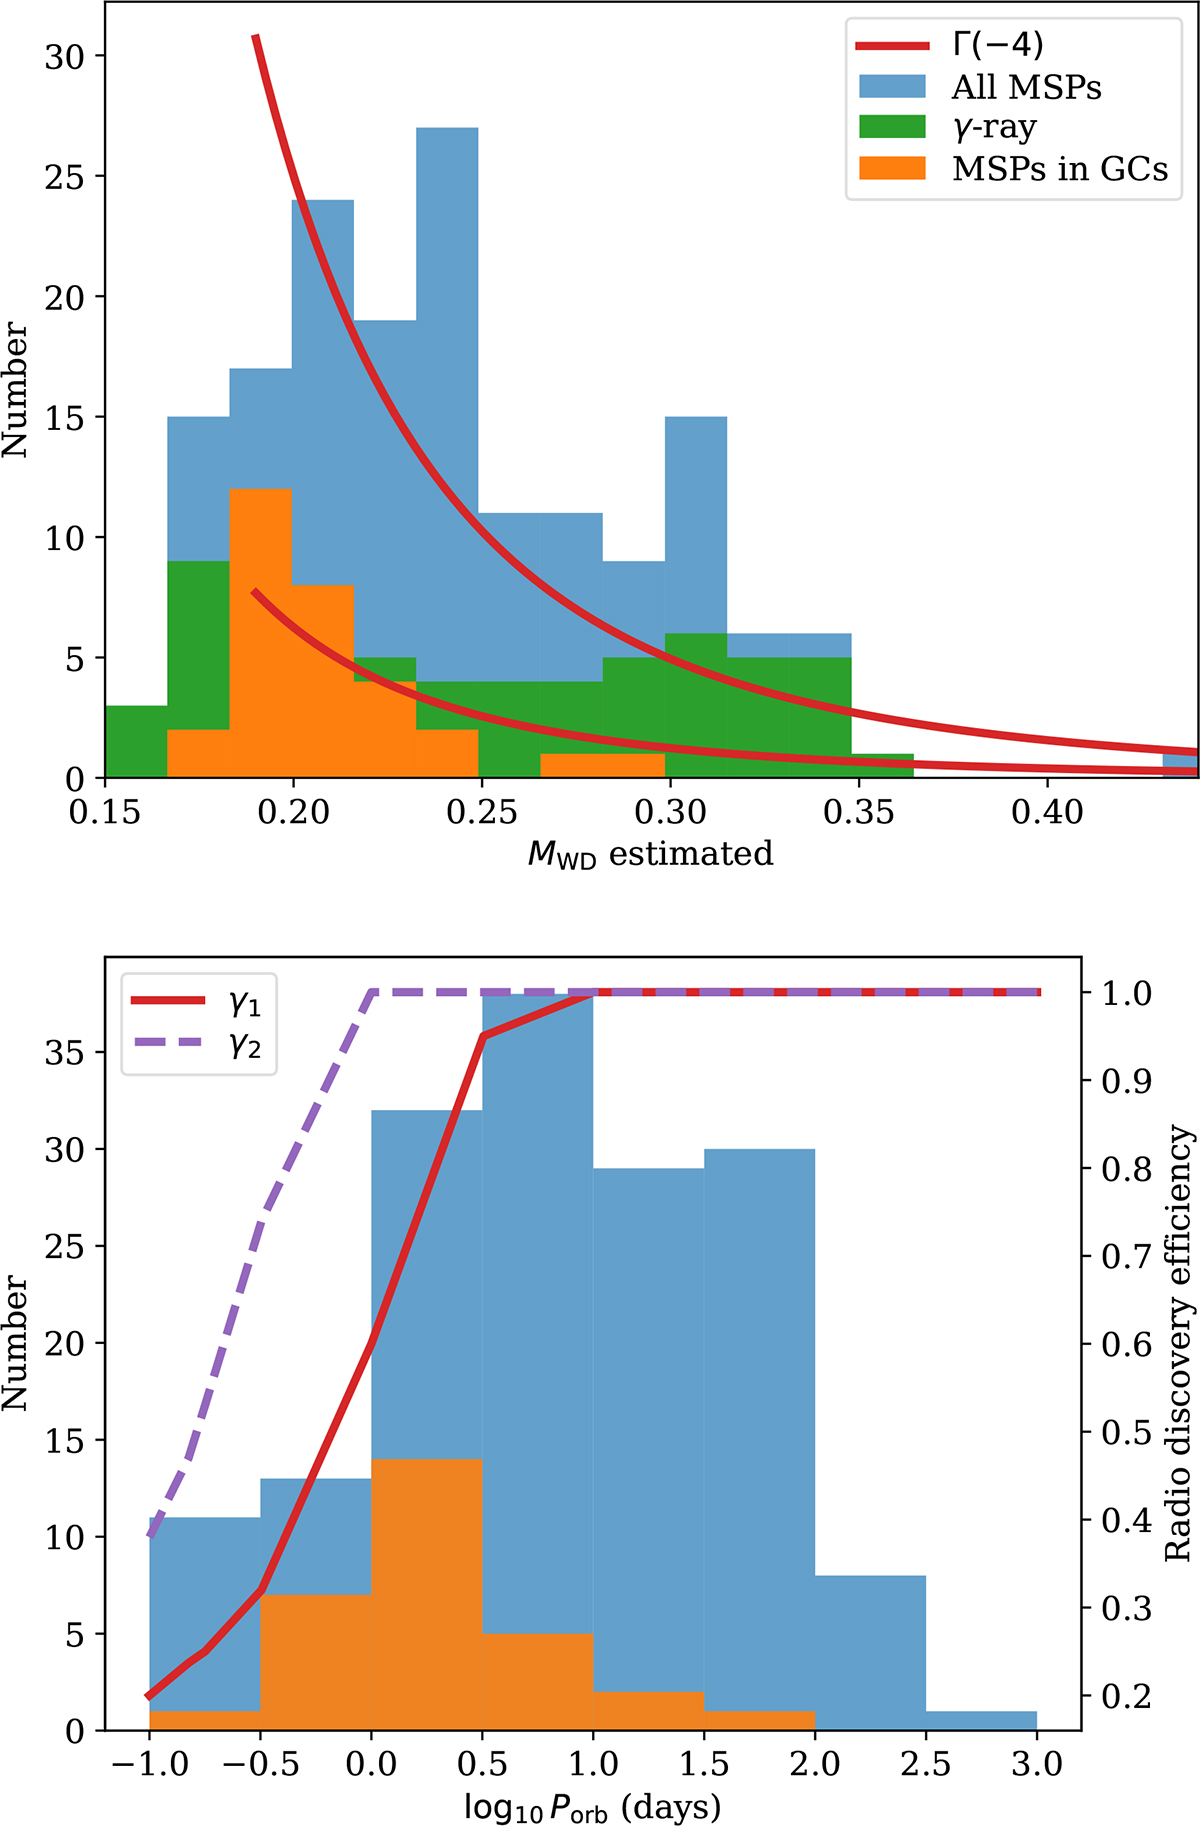
Download original image
Top panel: Distribution of companion masses for the MSP sample. The solid red lines show a power-law distribution with a slope of −4, plotted for comparison. Bottom panel: Distribution of binary orbital periods for the MSP sample. Overplotted are the estimated pulsar detection efficiencies in radio surveys, based on the modelling by Bagchi et al. (2013). Two search strategies are shown: γ1 for a standard (non-accelerated) search, and γ2 for an acceleration search. These detection efficiency curves are computed assuming the following orbital parameters: eccentricity e = 0, MMSP = 1.4 M⊙, integration time Tobs = 1000 s, WD companion mass derived from the Tauris & Savonije (1999) relation, spin period of 3 ms, orbital inclination i = 60°, and longitude of periastron Ω = 30°.
Current usage metrics show cumulative count of Article Views (full-text article views including HTML views, PDF and ePub downloads, according to the available data) and Abstracts Views on Vision4Press platform.
Data correspond to usage on the plateform after 2015. The current usage metrics is available 48-96 hours after online publication and is updated daily on week days.
Initial download of the metrics may take a while.