Fig. 4.
Download original image
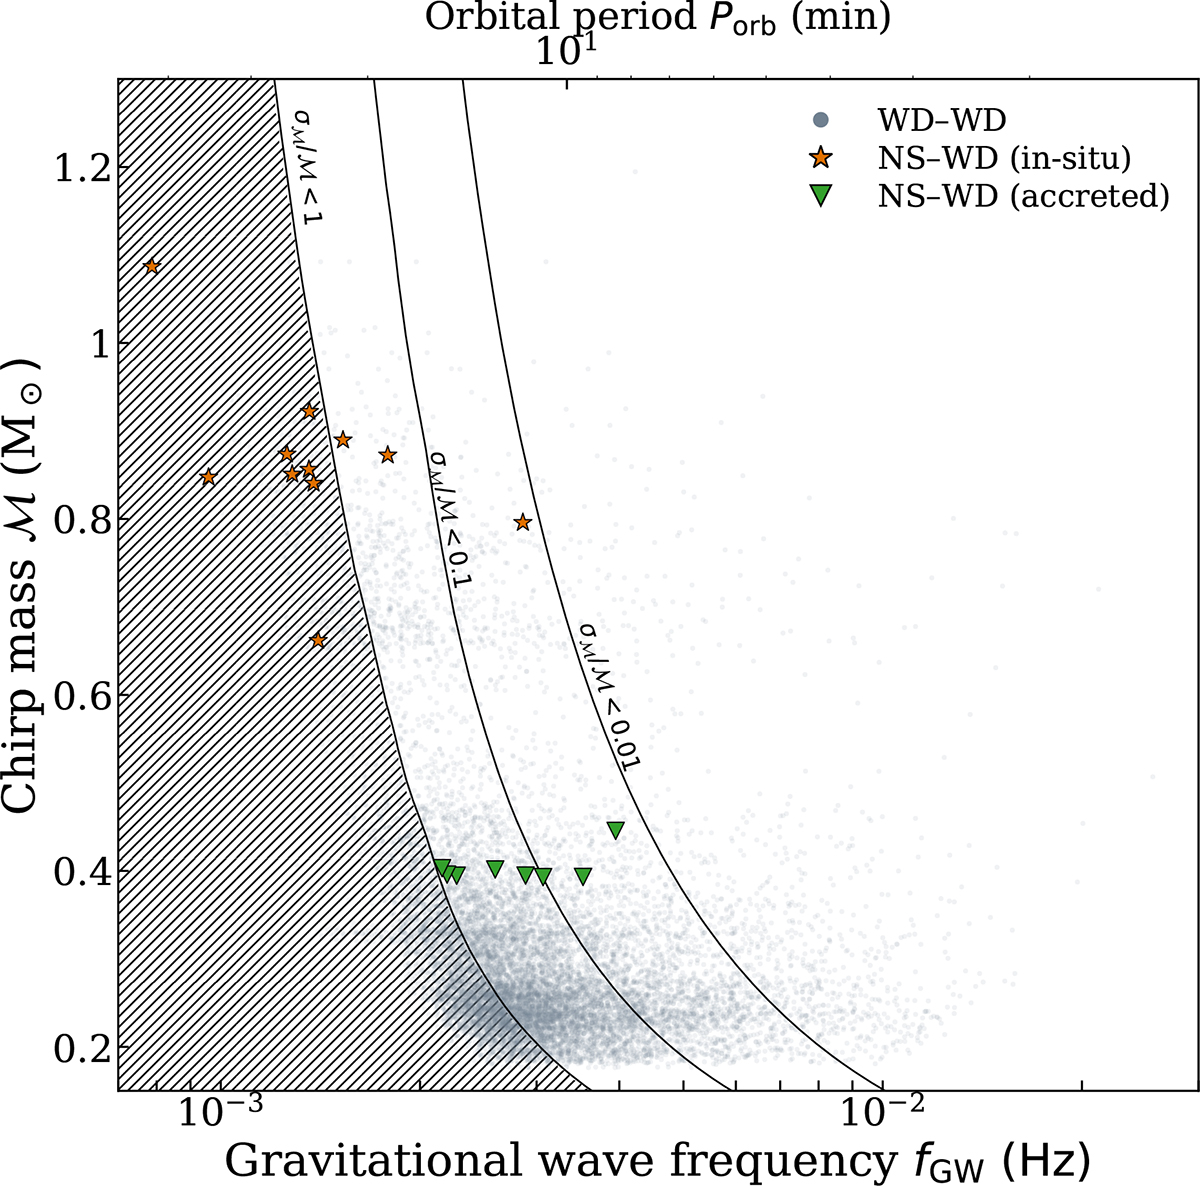
Detectable MSPWD binaries in the chirp mass–gravitational-wave frequency plane for both formation scenarios considered in this study. The in situ population is shown with orange stars, while systems from the accreted scenario are marked with green downward-pointing triangles. For comparison, the underlying population of detectable WDWD binaries is shown in blue-grey. Contours indicate regions of constant relative uncertainty in the chirp mass (σℳ/ℳ) at levels of 1, 0.1, and 0.01, highlighting LISA’s ability to constrain binary parameters. The hatched region marks the part of parameter space where the chirp mass cannot be reliably measured (σℳ/ℳ > 1). The top axis shows the corresponding orbital period.
Current usage metrics show cumulative count of Article Views (full-text article views including HTML views, PDF and ePub downloads, according to the available data) and Abstracts Views on Vision4Press platform.
Data correspond to usage on the plateform after 2015. The current usage metrics is available 48-96 hours after online publication and is updated daily on week days.
Initial download of the metrics may take a while.