Fig. F.1
Download original image
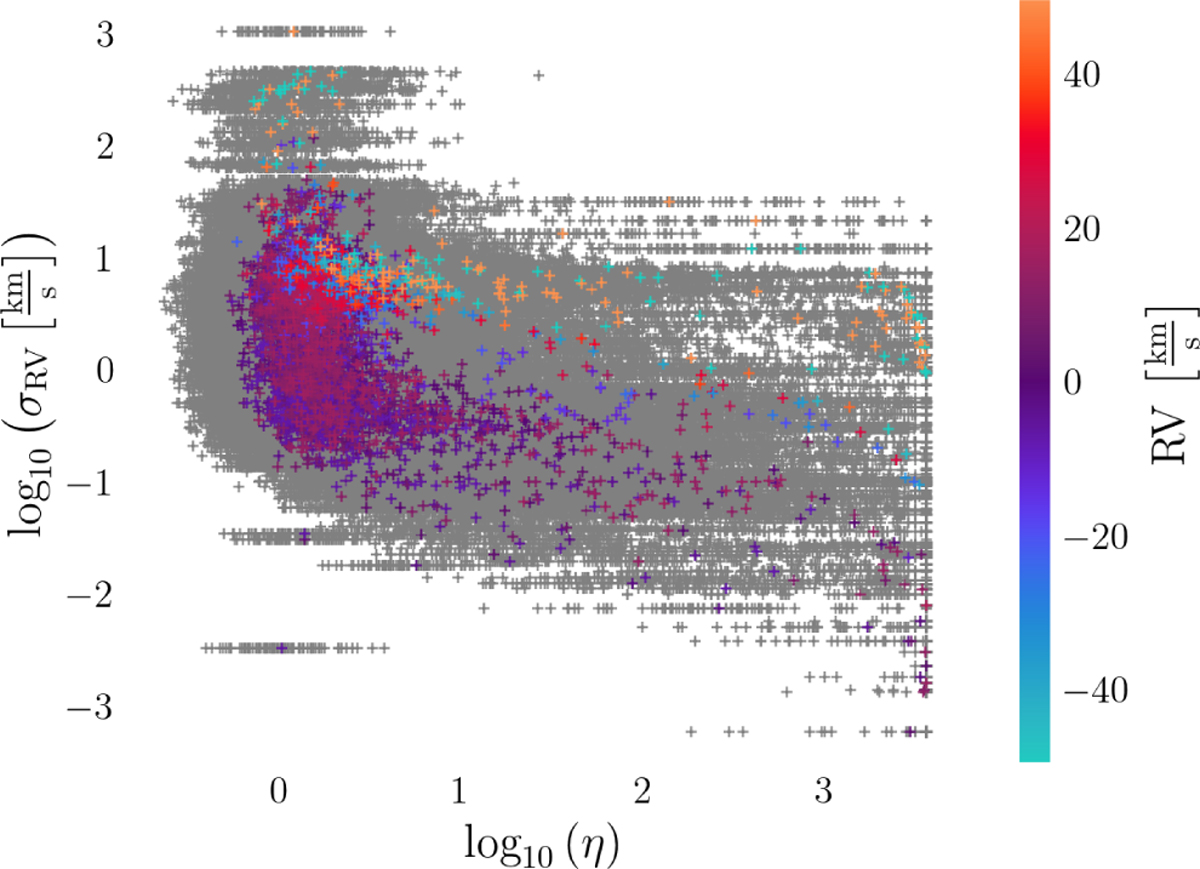
Noise estimation results. The plot shows the inferred noise estimation factors η per RV measurement versus the log-scaled observed uncertainties. The observed RV data are shown as a color scale. The scale is saturated at ±50 km s−1. The posterior samples of η are in gray, thereby illustrating the statistical uncertainties of the result.
Current usage metrics show cumulative count of Article Views (full-text article views including HTML views, PDF and ePub downloads, according to the available data) and Abstracts Views on Vision4Press platform.
Data correspond to usage on the plateform after 2015. The current usage metrics is available 48-96 hours after online publication and is updated daily on week days.
Initial download of the metrics may take a while.