Fig. 2
Download original image
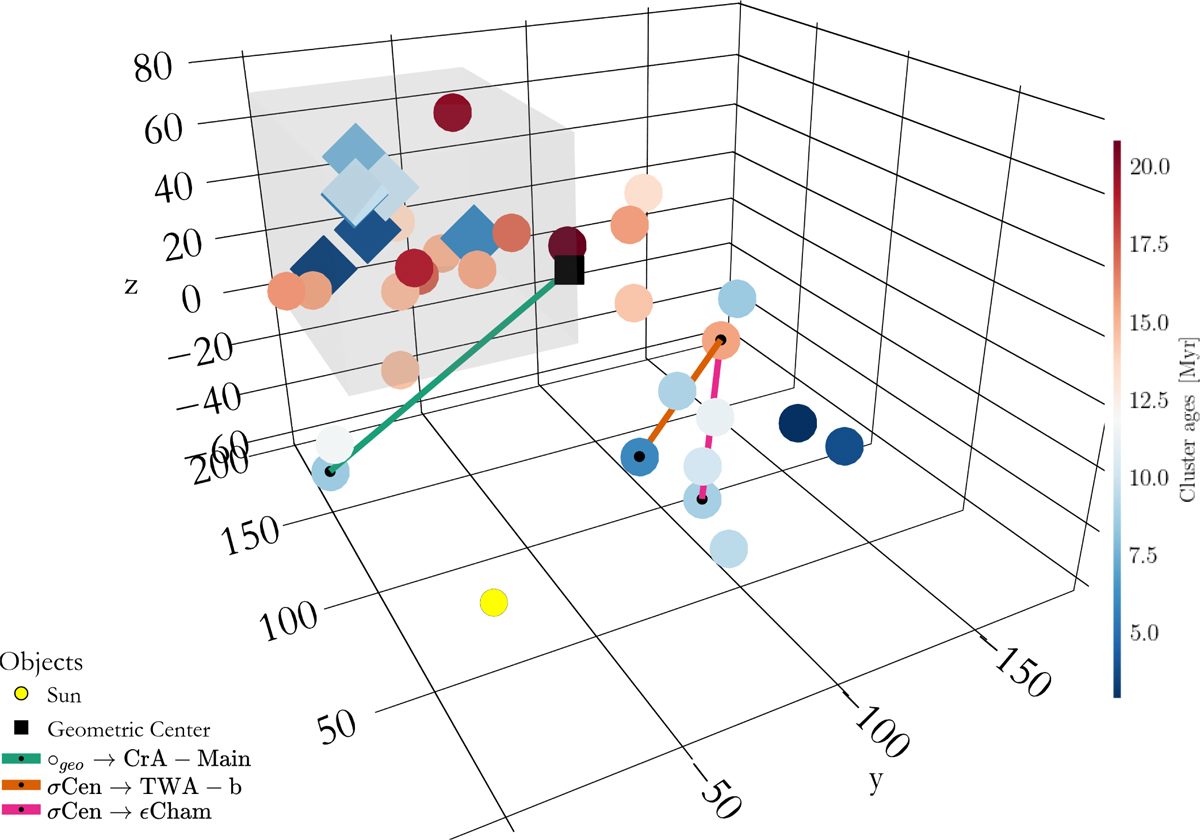
Orientation plot. This image shows the location and ages of the Sco-Cen clusters (R23a; R23b; MR25). The clusters that contain the stars that we refer to as the main sub-selection are shown as spheres, while the secondary clusters are shown as diamonds. We shade the volume where the secondary selection was performed in gray. The black square indicates the geometric center of Sco-Cen (G25). Additionally, we show three cluster chains as lines. A 3D interactive version of this plot is available online. We note that not all features mentioned are visible in this projection; we refer the reader to the online version for best visibility. Furthermore, individual clusters are identifiable in the online version.
Current usage metrics show cumulative count of Article Views (full-text article views including HTML views, PDF and ePub downloads, according to the available data) and Abstracts Views on Vision4Press platform.
Data correspond to usage on the plateform after 2015. The current usage metrics is available 48-96 hours after online publication and is updated daily on week days.
Initial download of the metrics may take a while.