Fig. 3
Download original image
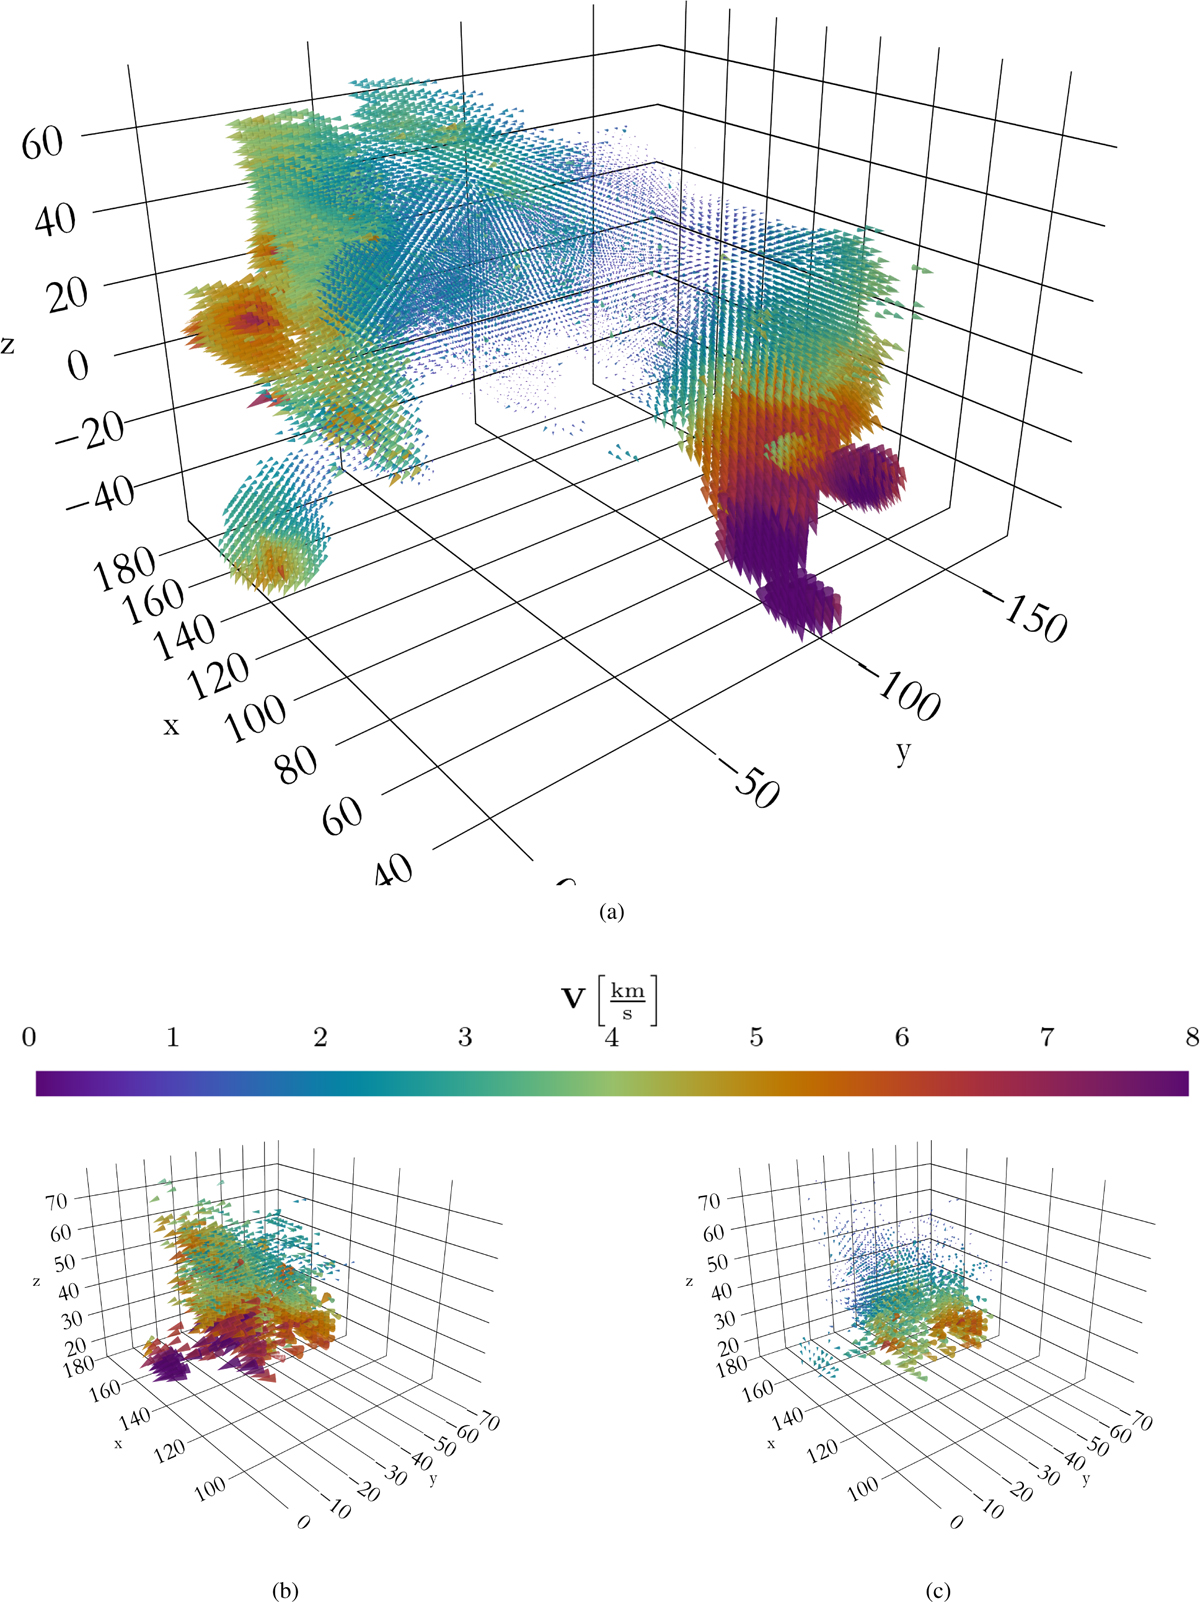
Posterior mean of the flow fields in the velocity reference frame of G25. For each plot, we have defined a mask using the density of stars to highlight only parts of the volume that were directly informed by data as described in Sect. 4.1. Fig. 3a depicts the main field, while Figs. 3b and 3c depict the secondary and δ field. These projections of the vector fields can naturally only provide a first impression and might locally be misleading; for a better depiction, we refer to the 3D interactive version of these plots available online.
Current usage metrics show cumulative count of Article Views (full-text article views including HTML views, PDF and ePub downloads, according to the available data) and Abstracts Views on Vision4Press platform.
Data correspond to usage on the plateform after 2015. The current usage metrics is available 48-96 hours after online publication and is updated daily on week days.
Initial download of the metrics may take a while.