Fig. 4
Download original image
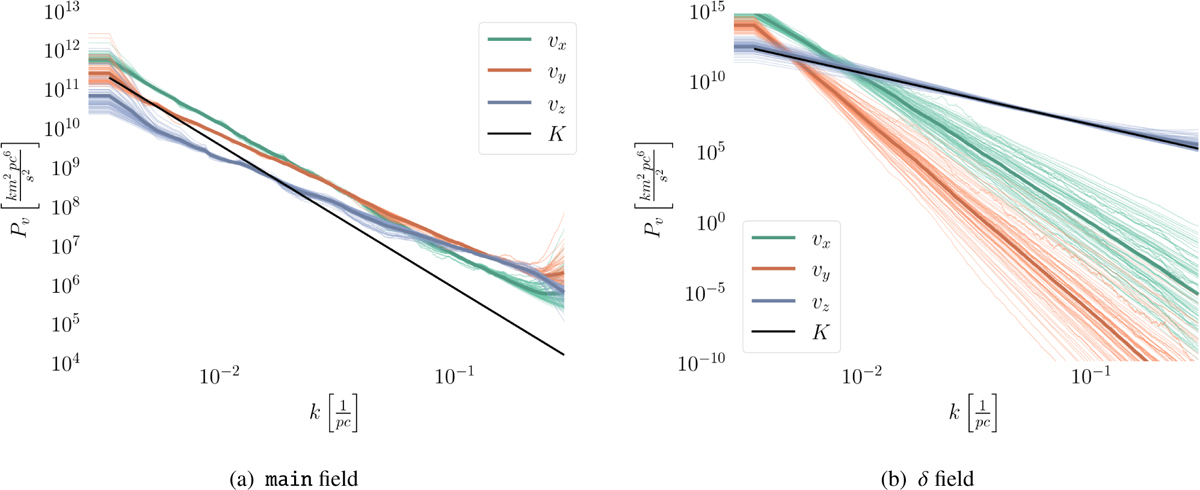
Power spectra of the main and δ velocity field components, which are part of the forward model. The black line indicates the Kolmogorov slope −11/3, while the posterior samples are indicated as thin colored lines. We have scaled the line indicating the Kolmogorov spectrum to the average of the three component spectra at k = 0.005 pc−1 in each case, for illustrational purposes.
Current usage metrics show cumulative count of Article Views (full-text article views including HTML views, PDF and ePub downloads, according to the available data) and Abstracts Views on Vision4Press platform.
Data correspond to usage on the plateform after 2015. The current usage metrics is available 48-96 hours after online publication and is updated daily on week days.
Initial download of the metrics may take a while.