Fig. 6
Download original image
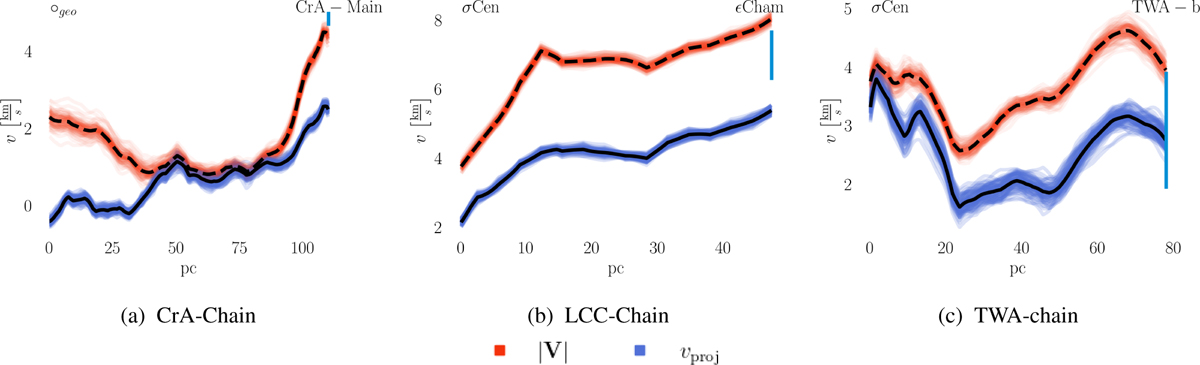
Projected velocity profiles of the main velocity field in the reference frame of Posch et al. (2025) along the CrA, LCC, and TWA chains analyzed in P23; P25 and MR25. We note that in the case of the CrA chain, the starting point is the geometric center of Sco-Cen as defined in G25, while for the other two, it is the center of the σ-Cen cluster. The projection of the field onto the chain is shown in blue, while the absolute 3D magnitude is depicted in red. All quantities are accompanied by the respective posterior samples in lower opacity to illustrate uncertainties. We have included the values derived in the literature for the respective clusters at the end of the chains on the right of the plots as blue bars.
Current usage metrics show cumulative count of Article Views (full-text article views including HTML views, PDF and ePub downloads, according to the available data) and Abstracts Views on Vision4Press platform.
Data correspond to usage on the plateform after 2015. The current usage metrics is available 48-96 hours after online publication and is updated daily on week days.
Initial download of the metrics may take a while.