Fig. C.1
Download original image
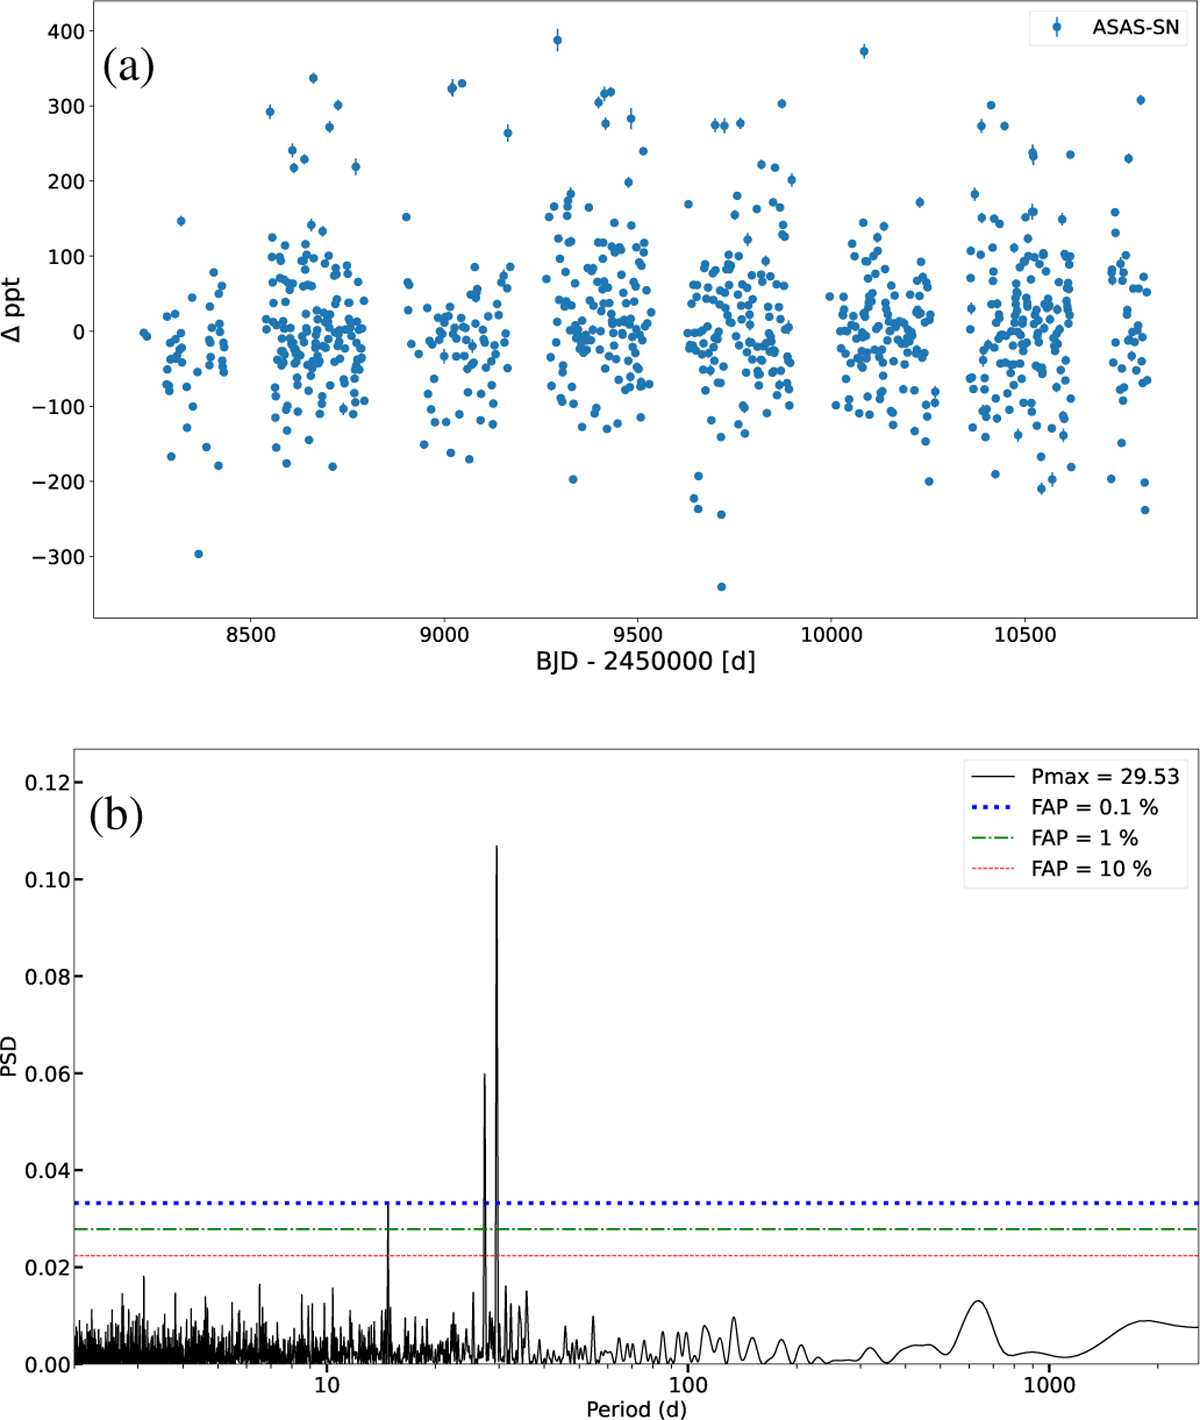
ASAS-SN dataset and GLS periodogram for HD176986. Panel (a): ASAS-SN time series for g-band filter. Panel (b): GLS periodogram of the ASAS-SN photometry collected in the g band. We see significant peaks at 29.56 d, 14.78 d, and 27.43 d. These periods correspond with the synodic period of the Moon, half of the synodic period, and the sidereal period of the Moon.
Current usage metrics show cumulative count of Article Views (full-text article views including HTML views, PDF and ePub downloads, according to the available data) and Abstracts Views on Vision4Press platform.
Data correspond to usage on the plateform after 2015. The current usage metrics is available 48-96 hours after online publication and is updated daily on week days.
Initial download of the metrics may take a while.