Fig. 2
Download original image
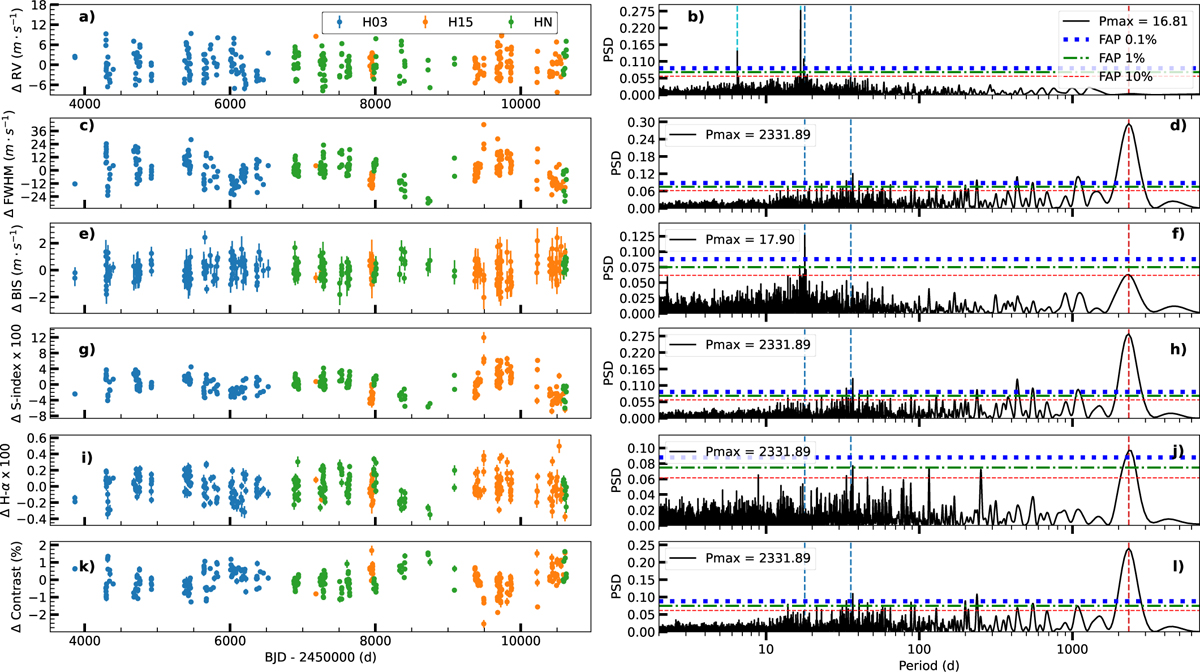
Time series of RV and activity indicators. Panel a: RV time series. Panel b: GLS periodogram related to the RV time series. We see two prominent peaks in correspondence with the two planets detected in Suárez Mascareño et al. (2018). Panels c, e, g, i, and k: activity indicators time series. Panels d, f, h, j, and l: corresponding GLS periodograms. The red, green, and blue lines in the periodogram indicate a power corresponding to a 10%, 1%, and 0.1% FAP, respectively. Panels c and d: FWHM. We see a strong peak in the GLS periodogram at 2331.89 d. Panels e and f: bisector. The strongest peak in the GLS periodogram is at 17.9 d period. This peak is likely related to stellar rotation. A weaker peak at FAP ∼10% in correspondence with the magnetic cycle is also visible at a long period. Panels g and h: S index. In panel h, we see again a strong peak at 2331.89 d, caused by the magnetic cycle. In panels i and j, we see the time series and the GLS periodogram of Hα. We see again a peak at 2331.89 d due to the magnetic cycle of the star. Panels k and j: time series and the GLS periodogram of Contrast. We can also find in this dataset the signature of the magnetic cycle in the peak at 2331.89 d in the GLS periodogram. FWHM, S index, Hα, and Contrast all show an additional peak at ∼35 d. This peak is related to the rotation period of the star as shown in the analysis of stellar activity.
Current usage metrics show cumulative count of Article Views (full-text article views including HTML views, PDF and ePub downloads, according to the available data) and Abstracts Views on Vision4Press platform.
Data correspond to usage on the plateform after 2015. The current usage metrics is available 48-96 hours after online publication and is updated daily on week days.
Initial download of the metrics may take a while.