Fig. 11
Download original image
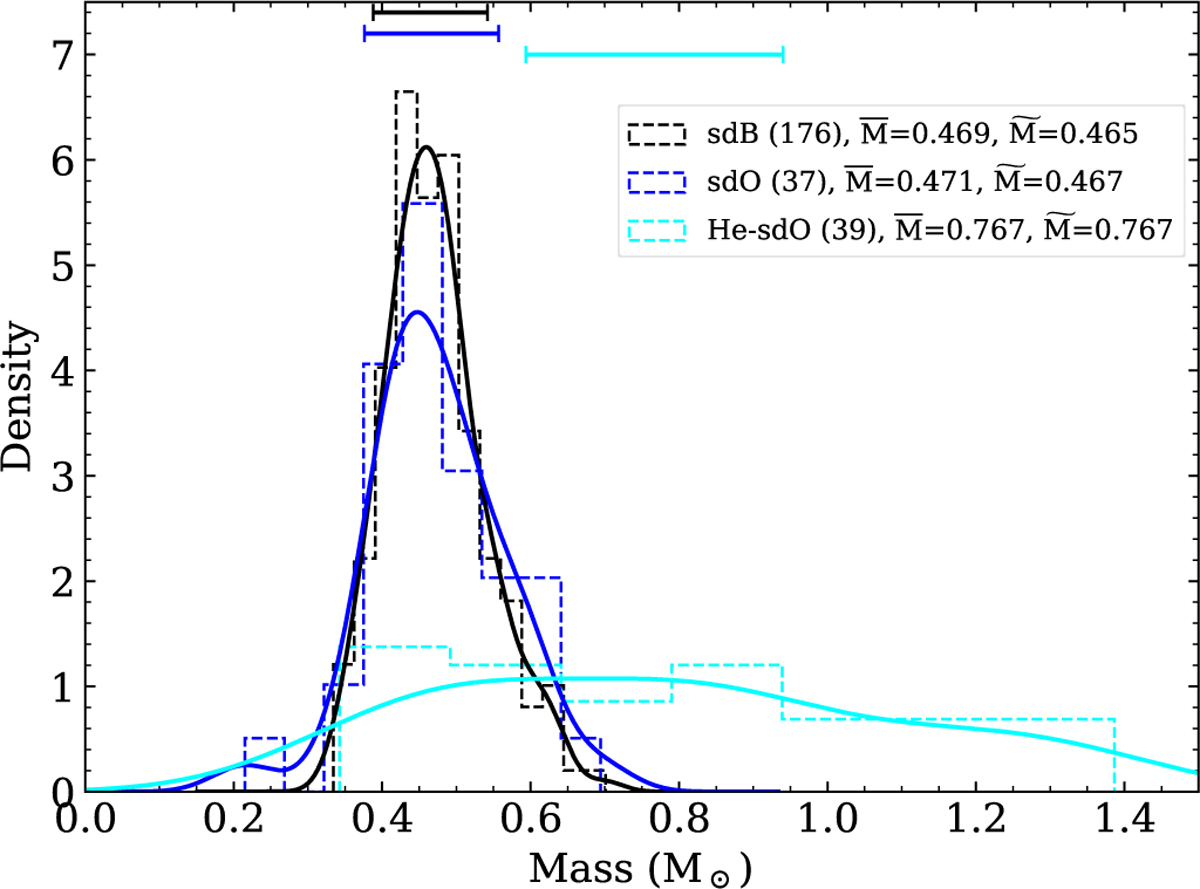
Mass distribution obtained from parallaxes and SED fits for the sdBs, sdOs, and He-sdOs in our sample. The dashed lines show the normalized histograms for each spectral group and the solid curves are the associated kernel density function. The stars with a composite SED were excluded. In the legend, we indicated the number of stars in parenthesis as well as the average (M̄) and median (M̃) mass for each spectral type. The error bars on top are indicative of the mass uncertainty for each spectral type (see Merr in Table 2).
Current usage metrics show cumulative count of Article Views (full-text article views including HTML views, PDF and ePub downloads, according to the available data) and Abstracts Views on Vision4Press platform.
Data correspond to usage on the plateform after 2015. The current usage metrics is available 48-96 hours after online publication and is updated daily on week days.
Initial download of the metrics may take a while.