Fig. 2
Download original image
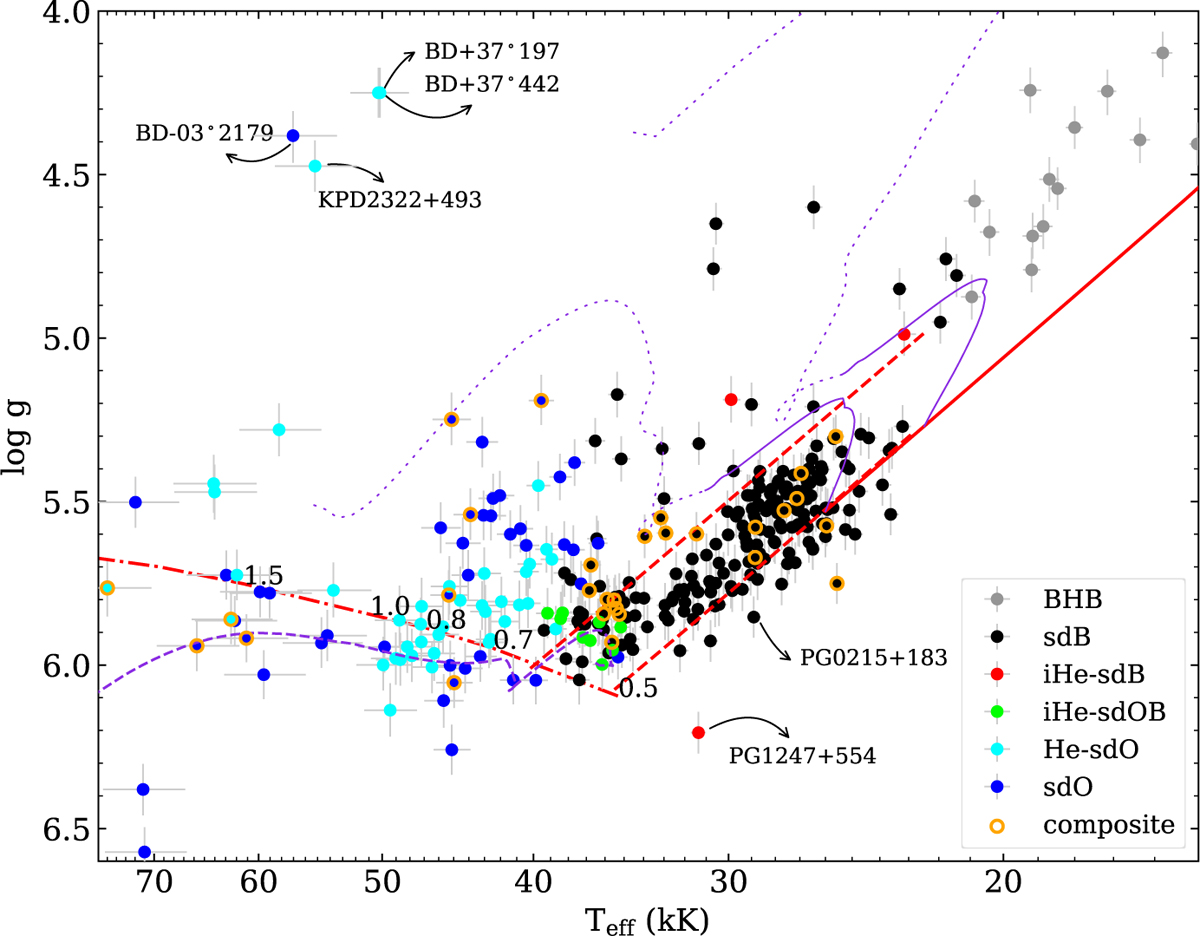
Surface gravity (log g) as a function of Teff (Kiel diagram) for the stars in the Bok sample. The six spectral groups are indicated with symbols of different colors. Stars with IR excess are marked with an additional orange circle (see Sect. 4.1.2). The ZAEHB and TAEHB computed with STELUM for a core mass of 0.47 M⊙ are shown with red dashed lines. The ZAEHB extension below 20 kK (solid red line) is from BaSTI models. Two BaSTI evolutionary tracks are shown in purple, the solid part represents the core-He burning phase, while the dotted part is the post-EHB phase. The dashed purple track is from a late-flasher model. The dashed-dotted red line is the ZAHeMS with the stellar masses indicated along the line. References for the theoretical models are listed in Sect. 4.1.1.
Current usage metrics show cumulative count of Article Views (full-text article views including HTML views, PDF and ePub downloads, according to the available data) and Abstracts Views on Vision4Press platform.
Data correspond to usage on the plateform after 2015. The current usage metrics is available 48-96 hours after online publication and is updated daily on week days.
Initial download of the metrics may take a while.