Open Access
Fig. 3
Download original image
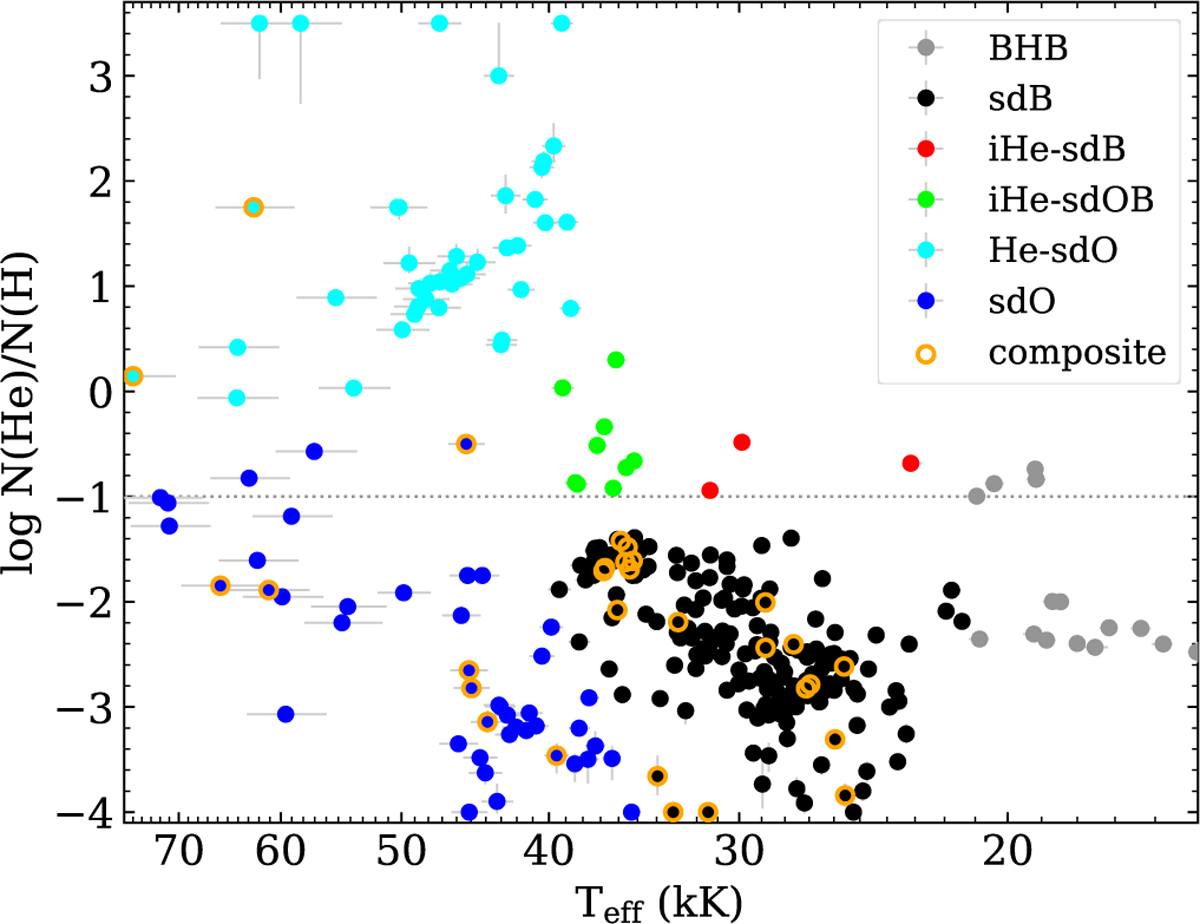
Helium abundance as a function of Teff for the stars in the Bok sample. The spectral groups are indicated following the same color scheme as in Fig. 2. The solar helium abundance is indicated with the dotted line.
Current usage metrics show cumulative count of Article Views (full-text article views including HTML views, PDF and ePub downloads, according to the available data) and Abstracts Views on Vision4Press platform.
Data correspond to usage on the plateform after 2015. The current usage metrics is available 48-96 hours after online publication and is updated daily on week days.
Initial download of the metrics may take a while.