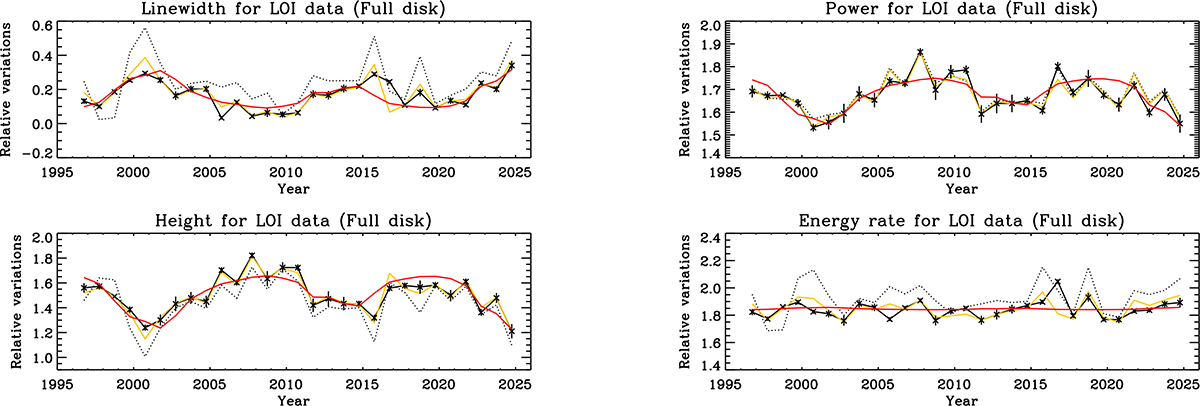
Fig. 15.
Download original image
Mode parameter variation as a function of time for linewidth. (Top, left), power (top, right), height (bottom, left) and energy rate (bottom, right). The continuous black line is for the globally fitted data with a free background, while the dotted line is for a fixed background. The correction of the parameters obtained for a fixed background is shown as an orange line; the correction is performed like in Appourchaux et al. (2014). The red lines shows the linear fit of each parameter to the 10.7 cm flux.
Current usage metrics show cumulative count of Article Views (full-text article views including HTML views, PDF and ePub downloads, according to the available data) and Abstracts Views on Vision4Press platform.
Data correspond to usage on the plateform after 2015. The current usage metrics is available 48-96 hours after online publication and is updated daily on week days.
Initial download of the metrics may take a while.