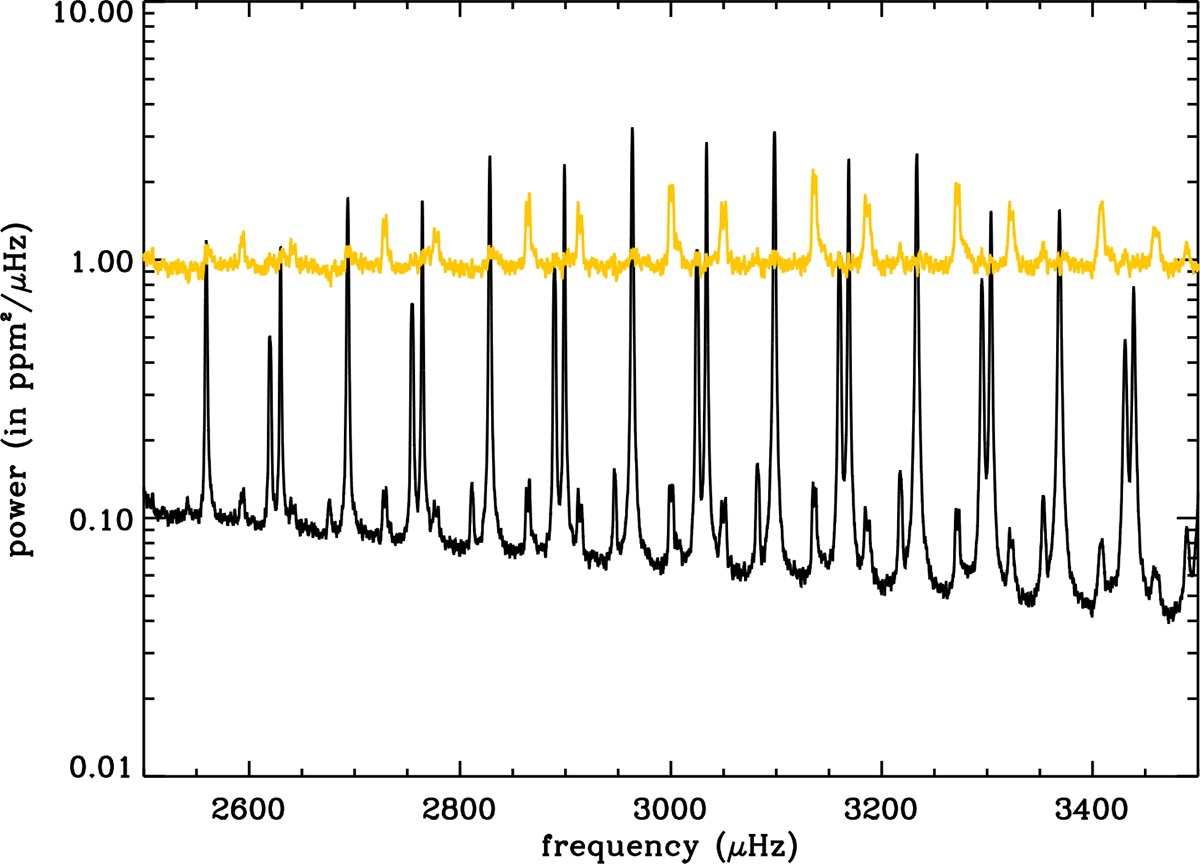
Fig. 16.
Download original image
Power spectrum as a function of frequency for 29 years (black line); ratio of the power spectrum to that of the fitted mode as a function of frequency (orange line) showing the remaining modes not included in the model. The remaining l = 4 modes are located on the left side of the l = 0 − 2 pair, while the remaining l = 5 modes with a lower amplitude are located on the right side of the l = 0 − 2 pair. (see also Fig. 17).
Current usage metrics show cumulative count of Article Views (full-text article views including HTML views, PDF and ePub downloads, according to the available data) and Abstracts Views on Vision4Press platform.
Data correspond to usage on the plateform after 2015. The current usage metrics is available 48-96 hours after online publication and is updated daily on week days.
Initial download of the metrics may take a while.