Fig. 17.
Download original image
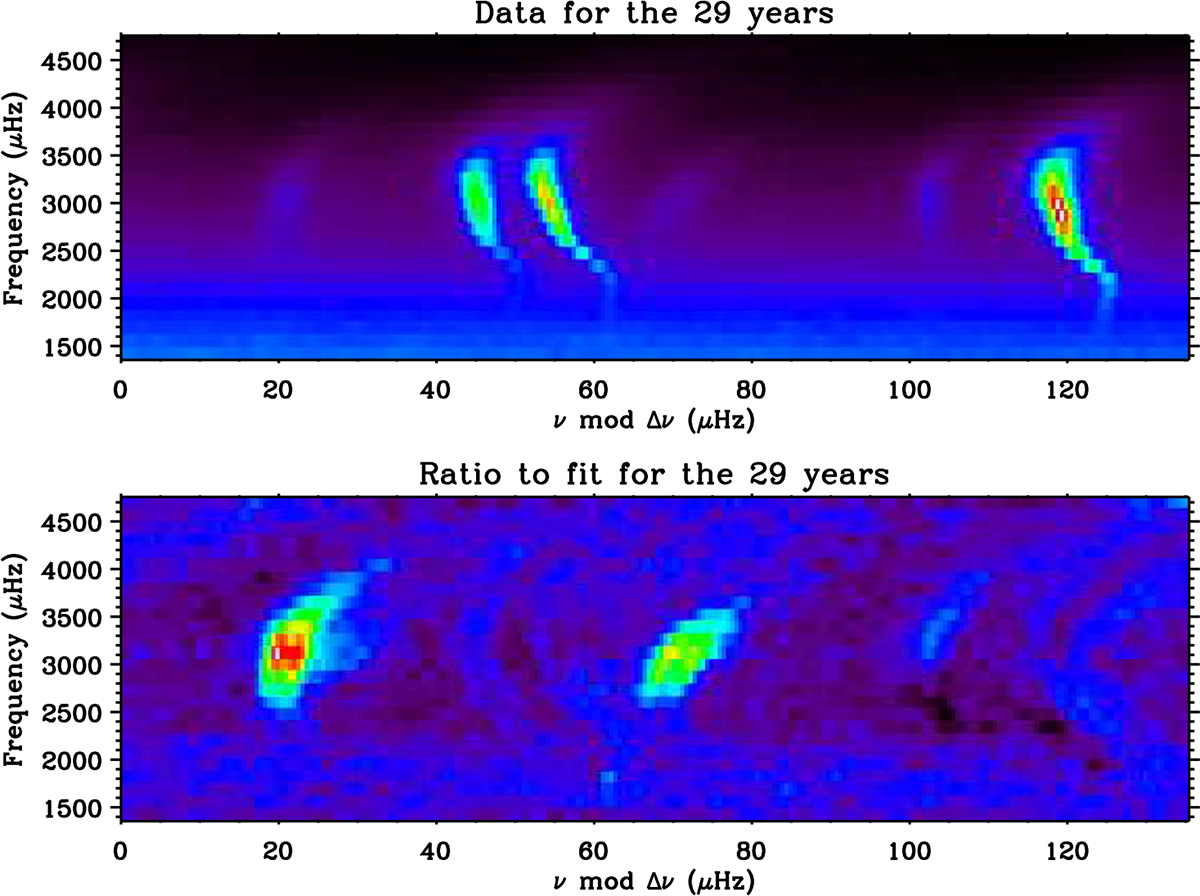
(Top) Echelle diagram of the power spectrum for 29 years of LOI FD data. The double ridges close to the centre are the l = 0 − 2 modes, while the ridge on the right side are the l = 1 modes, sided by the faint ridge of the l = 3 modes. (bottom) Echelle diagram of the ratio of the power spectrum to that of the fitted model for 29 years. The remaining ridge on the left side are the l= 4 modes, with a faint ridge of the l = 7 modes going through. The remaining ridge at the center are the l= 5 modes.
Current usage metrics show cumulative count of Article Views (full-text article views including HTML views, PDF and ePub downloads, according to the available data) and Abstracts Views on Vision4Press platform.
Data correspond to usage on the plateform after 2015. The current usage metrics is available 48-96 hours after online publication and is updated daily on week days.
Initial download of the metrics may take a while.