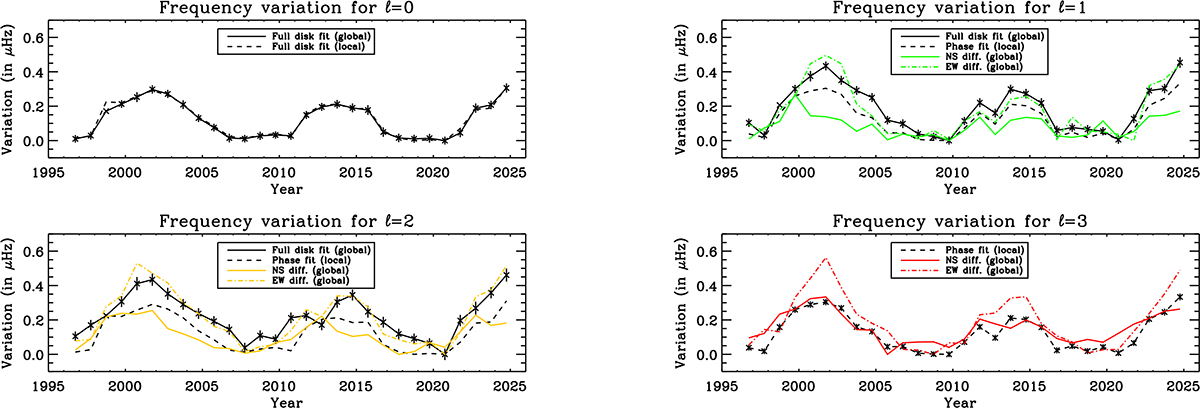
Fig. 7.
Download original image
Mean mode frequency variation as a function of time. (Top, left) for the l= 0 modes for the global fit (continuous line) and the local fit (dashed line). (Top, right) for the l= 1 modes for the global fit (continuous line), the local phase fit (dashed line), the global fit of north-south difference (green line) and the global fit of east-west difference (green dashed line). (Bottom, left) for the l= 2 modes for the global fit (continuous line), the local phase fit (dashed line), the global fit of north-south difference (orange line) and the global fit of east-west difference (orange dashed line). (Bottom, right) for the l= 3 modes for the local phase fit (dashed line), the global fit of north-south difference (red line) and the global fit of east-west difference (red dashed line). The l = 3 modes are not shown because they are too faint to give a meaningful full-disk signals.
Current usage metrics show cumulative count of Article Views (full-text article views including HTML views, PDF and ePub downloads, according to the available data) and Abstracts Views on Vision4Press platform.
Data correspond to usage on the plateform after 2015. The current usage metrics is available 48-96 hours after online publication and is updated daily on week days.
Initial download of the metrics may take a while.